Is XRP About to Break Out Above $3?
XRP is stuck in a tight range around $2.80, but with the Fed almost certain to cut rates this month, volatility is about to return.


The Federal Reserve’s September meeting is now the centerpiece of global market attention. With August’s jobs report coming in far weaker than expected, the Fed is almost locked into cutting rates by at least 25 basis points, and possibly 50. For risk assets like cryptocurrencies, this is a potential inflection point. XRP price, which has been consolidating around the $2.80–$2.85 zone, could be one of the key beneficiaries if liquidity flows back into digital assets.
XRP Price Prediction: Why the Fed’s Decision Matters for XRP?
Lower interest rates typically boost demand for riskier assets. When borrowing becomes cheaper and bond yields fall, capital often rotates into equities and cryptocurrencies in search of higher returns. Historically, XRP price has not just followed Bitcoin but also delivered outsized moves during liquidity-driven rallies. A dovish Fed, even if motivated by economic weakness, is therefore likely to provide near-term upside momentum for XRP.
Daily Chart: Testing Support at $2.80
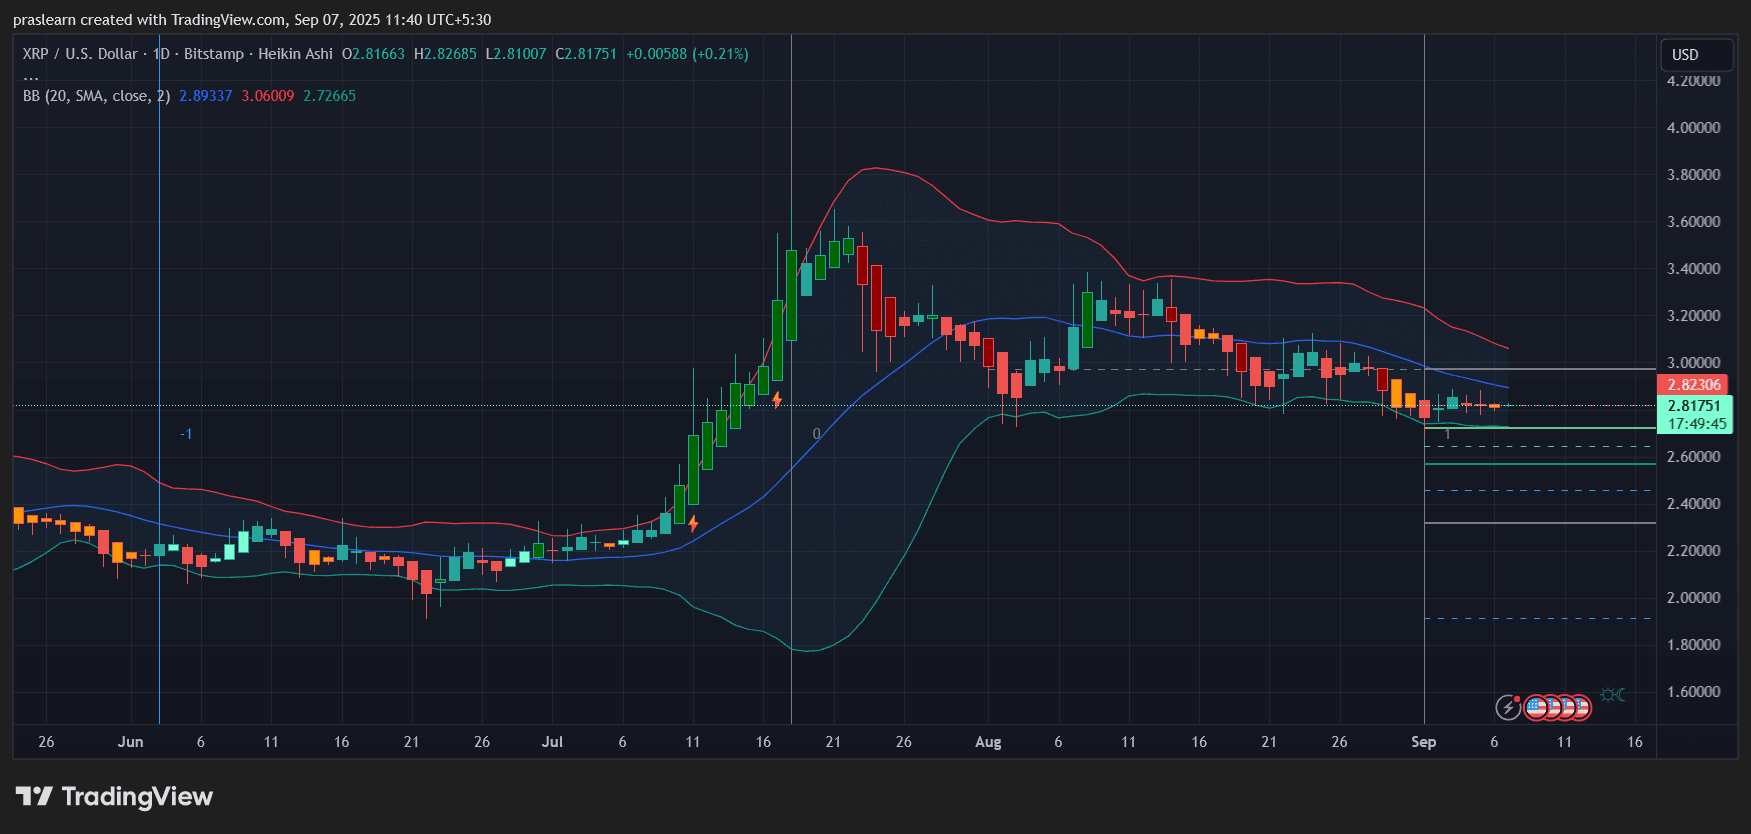
On the daily timeframe, XRP price is hovering near $2.82 after weeks of steady decline from its July peak above $4. The Bollinger Bands show price compressed near the lower band, which often signals an upcoming volatility spike. The $2.75–$2.80 zone has repeatedly held as a support base, making it a crucial line for bulls to defend. A daily close above $2.90 would strengthen the case for recovery, opening the path toward $3.20. Failure to hold $2.80, however, exposes XRP to deeper correction levels at $2.60 and even $2.30.
4-Hour Chart: Range-Bound but Coiling
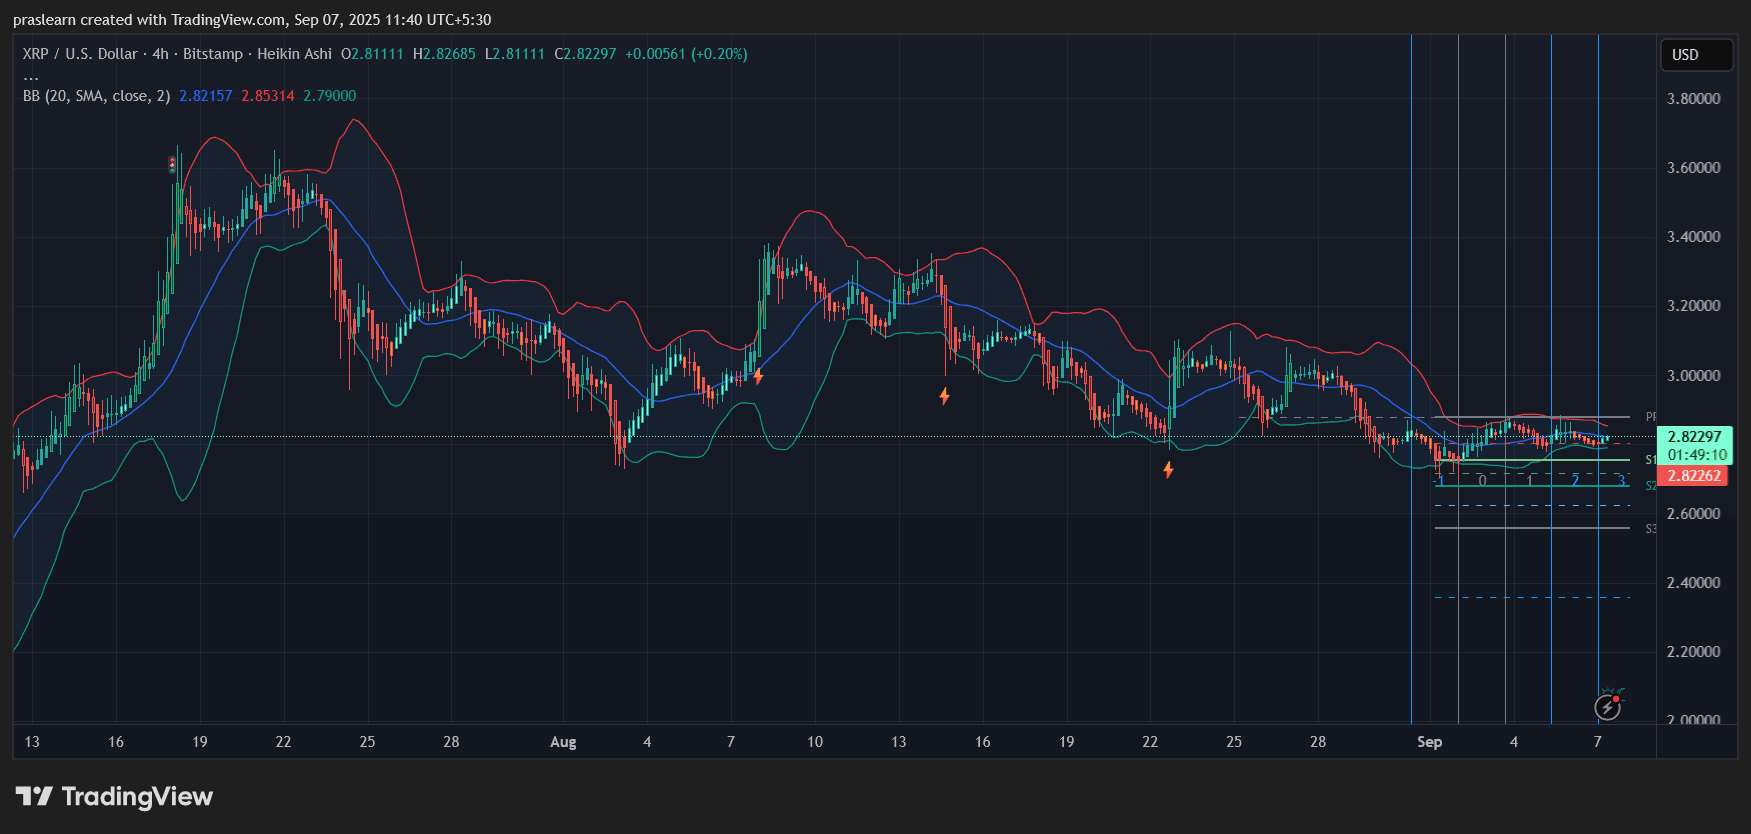
Zooming into the 4-hour chart, XRP price is trapped in a tight range between $2.80 and $2.90. Bollinger Bands are narrowing, showing declining volatility and hinting at an imminent breakout. The repeated defense of $2.80 over the past sessions signals accumulation. A breakout above $2.90 could quickly extend toward $3.05 and $3.25. On the downside, a breakdown below $2.80 risks a slide toward $2.65.
1-Hour Chart: Sideways Drift With Hidden Strength
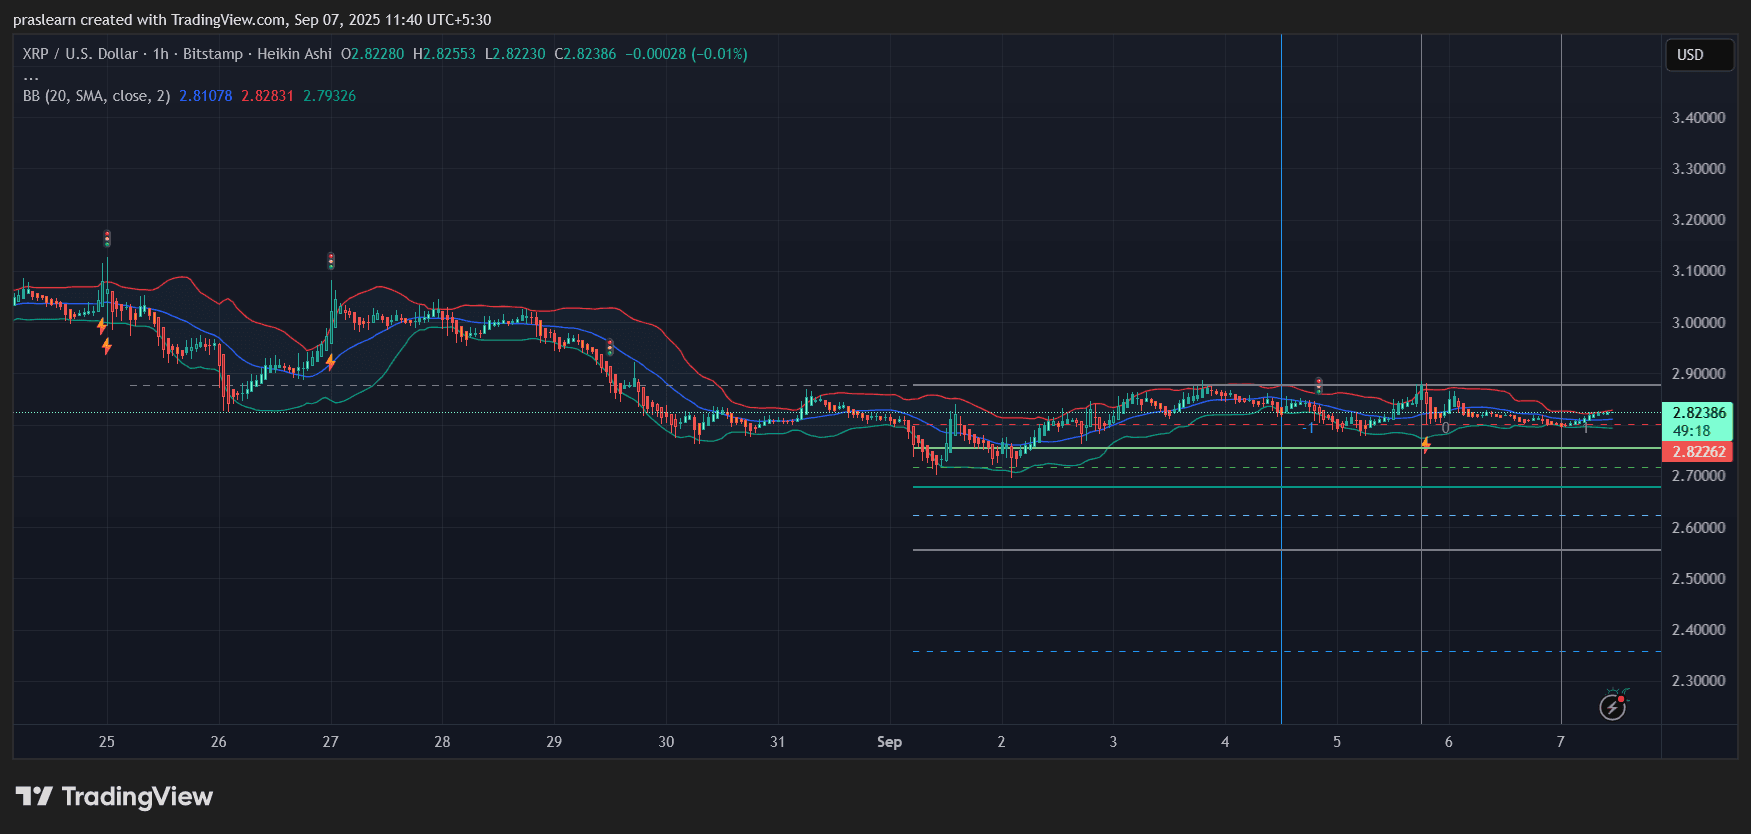
The hourly chart reveals XRP price consolidating with small-bodied candles near $2.82–$2.83. Despite the flat action, buyers have stepped in at every dip below $2.80. This suggests hidden strength. Short-term traders should watch for momentum above $2.85 as the first trigger for bullish continuation. The psychological $3 mark remains a key magnet for intraday moves once momentum shifts.
Range Chart: Micro Consolidation
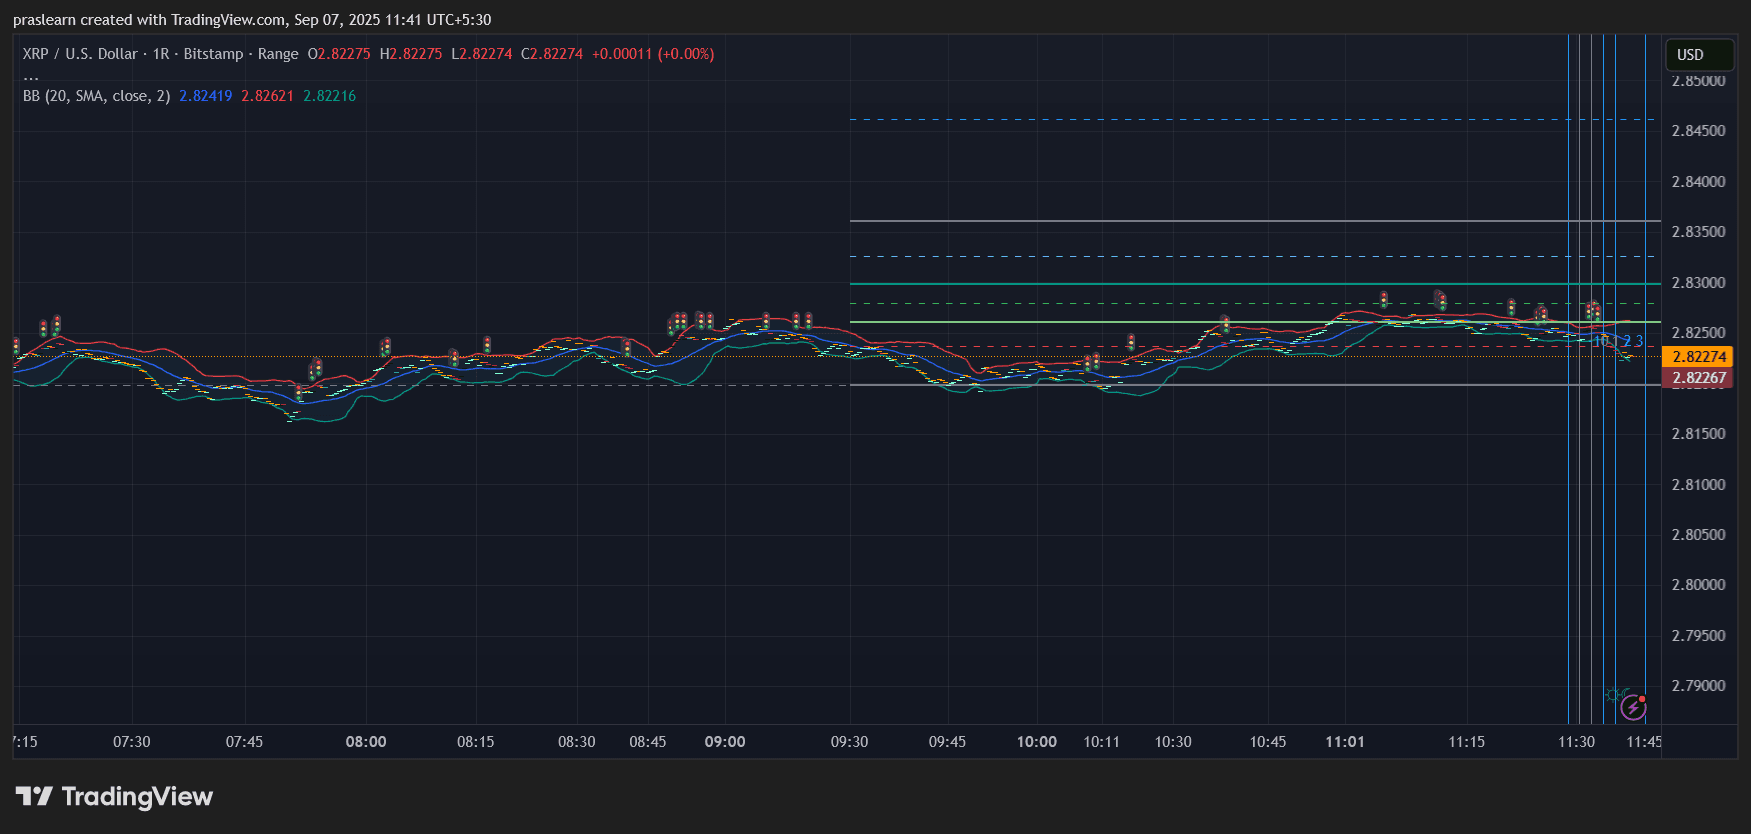
The range chart paints a picture of extremely tight intraday trading. XRP price is locked around $2.82 with compressed Bollinger Bands. This micro consolidation often precedes a sharp directional move. Given the broader macro backdrop, probabilities lean toward an upside breakout, provided the Fed delivers the expected rate cut.
Macro and Crypto Market Context
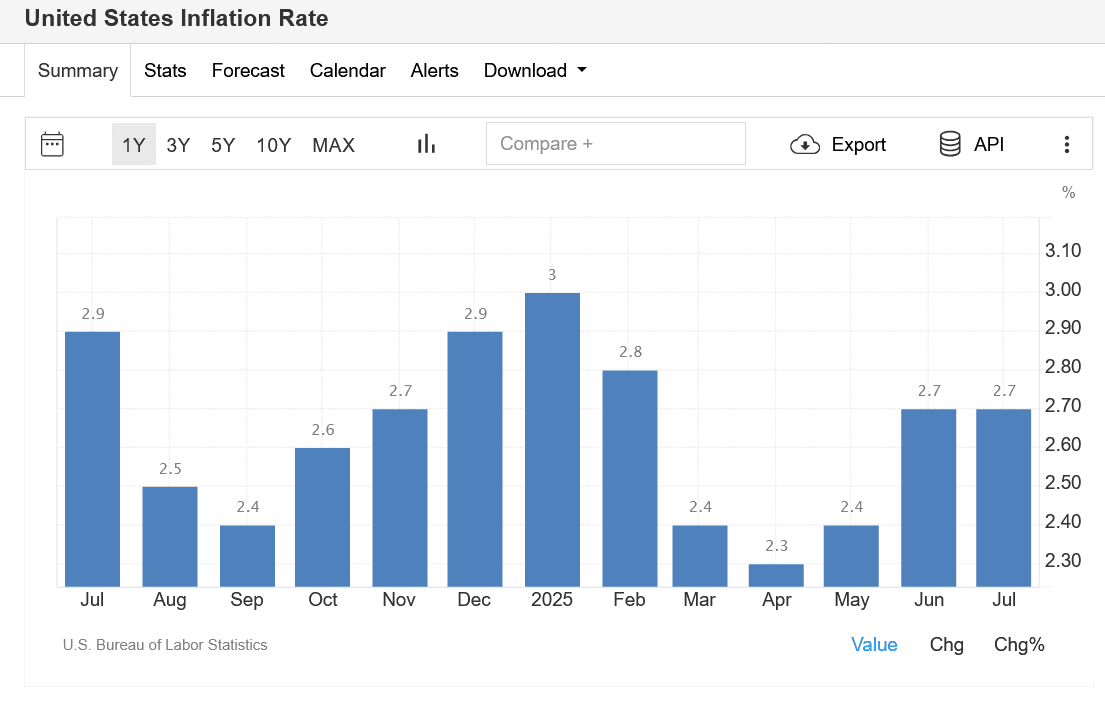
Inflation remains above target, but the Fed is prioritizing job market stability. This paradox—cutting rates while inflation lingers—creates a fertile setup for crypto. If inflation flares again post-cuts, Bitcoin may rally as a hedge, pulling XRP price along. If cuts stabilize growth, liquidity-driven buying could spread across altcoins, amplifying XRP’s gains.
XRP Price Prediction: What Comes Next for XRP?
In the near term, XRP’s price path is closely tied to the Fed’s September outcome. Here are the key scenarios:
Bullish case: A 25–50 bps rate cut injects liquidity, pushing XRP above $2.90, then toward $3.20–$3.25 in the coming weeks. If momentum builds, $3.50 becomes the next logical target.
Bearish case: If the Fed disappoints or inflationary fears dominate, $XRP risks breaking below $2.80, with $2.60 and $2.30 as key supports.
Base case: XRP holds the $2.80 floor and grinds higher, awaiting the Fed decision to confirm direction. Volatility is likely to spike in mid-September.
$XRP is at a decisive level. The charts show compression, the macro backdrop signals liquidity, and the Fed’s September decision could be the spark. Traders should closely monitor the $2.80–$2.90 zone—this is where the next big move begins.