Ethereum Price Prediction As Crypto Prices Adjust LOWER: No Need to Panick?
ETH is retesting a key pivot near $4,350 while the whole market cools after Bitcoin’s dip from ~$126.5K to ~$121K. Here’s the chart read and next targets.


$ETH price analysis today shows Ethereum pulling back to ~$4,33K, right on a well-watched pivot around $4,350. The move comes as the entire market is adjusting lower, with Bitcoin easing from its ATH, prompting broad de-risking. We break down the ETH chart, the critical supports/resistances, and the upside/downside price targets for $ETH.
Ethereum Price Today: Levels That Matter
- Pivot / Immediate zone: ~$4,350 (dotted line on your chart). ETH is hovering here after a quick pullback.
- 50-day SMA: ~$4,410 overhead. Price is currently below this line; reclaiming it would be a short-term bullish tell.
- Nearby resistance shelf: ~$4,600, then the psychological $5,000.
- Supports below: $3,840 (major), then $3,500, then $3,200. The 200-day SMA sits much lower near $3,100, acting as a last-ditch trend guardrail.
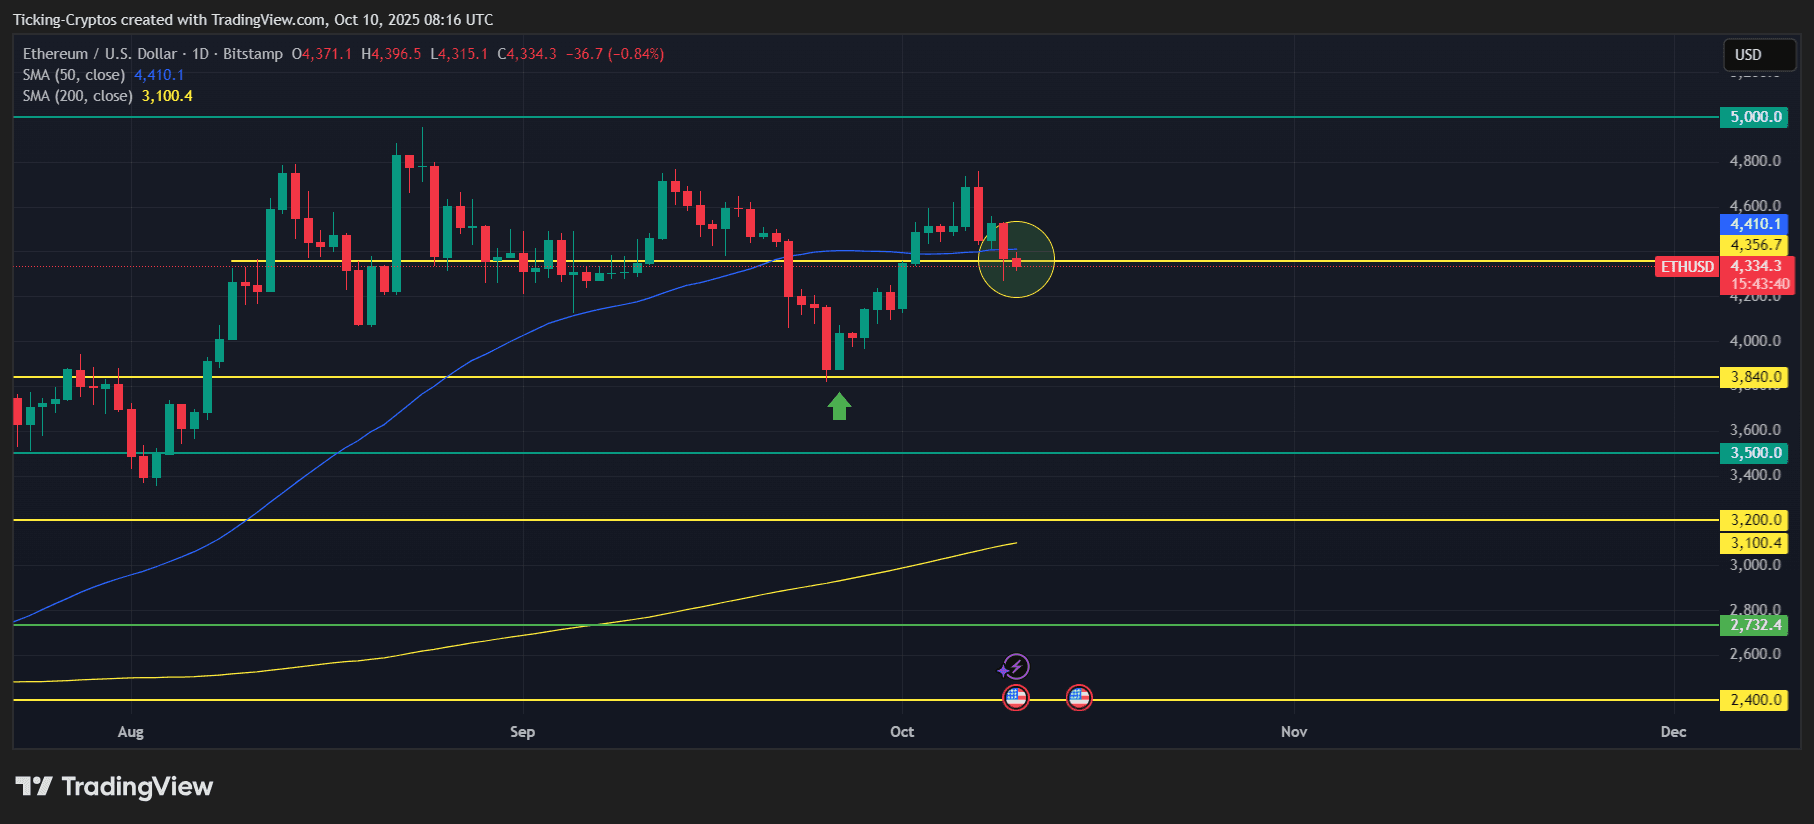
ETH/USD 1-day chart - TradingView
Market Context: BTC Sets the Tone
The latest $Ethereum dip lines up with a market-wide cooldown: $BTC slipped from an ATH ~$126.5K to roughly $121K. As long as BTC stabilizes above higher lows, ETH can attempt to base around $4.35K; a deeper BTC leg would likely pressure ETH into the $3.8K–$3.5K demand zone.
Scenario Map & Price Targets
Bull Case (reclaim momentum)
- Trigger: Daily close back above the 50-day SMA (~$4,410) and firm hold over the $4,350 pivot.
- Targets: $4,600 → $4,800 → $5,000. A clean break/close above $5,000 opens $5,250–$5,400 extension.

ETH/USD 1-day chart - TradingView
Base-Building (sideways consolidation)
- Trigger: Repeated defenses of $4,350 but failure to clear $4,410–$4,600.
- Range: $4,05K–$4,60K chop while the market digests BTC’s pullback.
- Outcome: Energy builds for a later push—direction likely follows BTC.
Bear Case (deeper correction)
- Trigger: Daily close below $4,350, then $4,200–$4,150 intraday fails.
- Targets: $3,840 first, then $3,500. If risk-off accelerates, $3,200 (with 200-DMA ~$3,100 in the vicinity) is a high-confluence support zone.

ETH/USD 1-day chart - TradingView