BREAKING: Ethereum Price Crashes Below $3,000 as Bitcoin Triggers Market Meltdown
Ethereum drops under $3,000 after Bitcoin’s fall below 92K. Chart signals deeper weakness as key support levels fail.


Ethereum Price Breaks the Critical $3,000 Support Level
$Ethereum has officially fallen under the psychological $3,000 mark, a major support that has held the price together for weeks.
This breakdown comes only hours after Bitcoin plunged below $92,000, triggering a market-wide selloff that dragged every major cryptocurrency sharply lower.
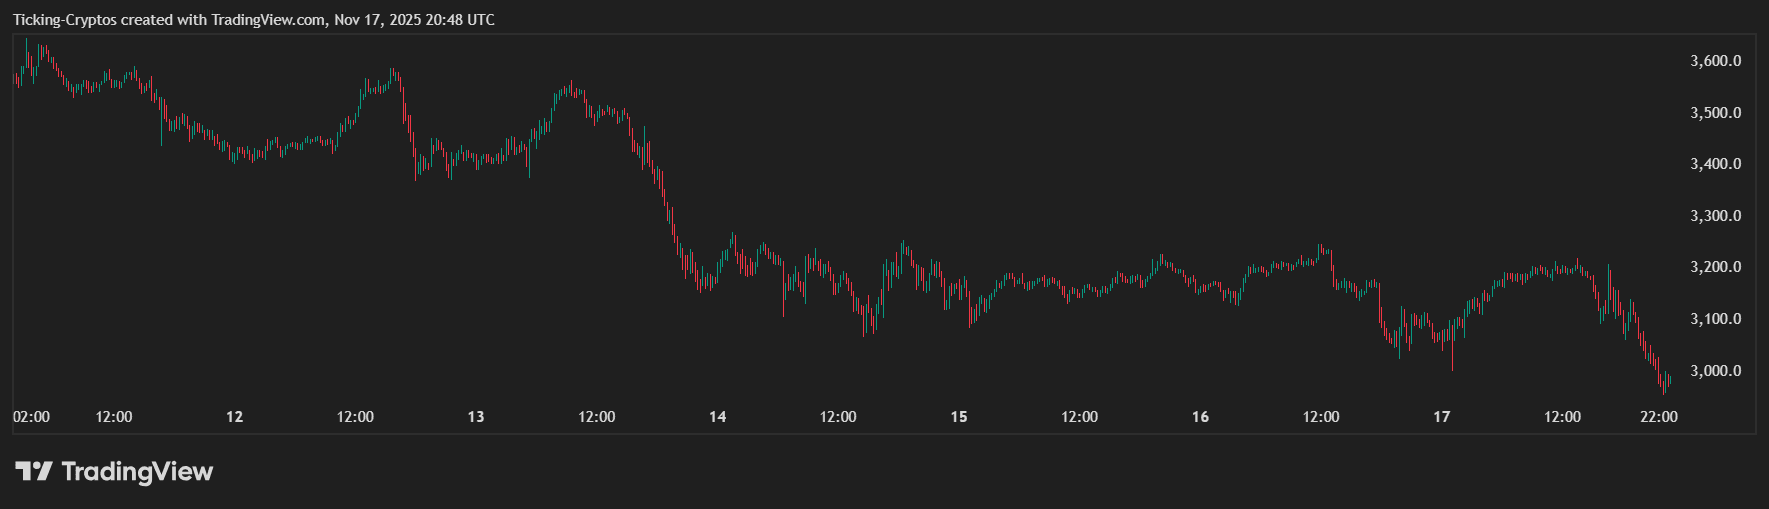
Ethereum price in USD over the past week - TradingView
ETH is now entering a dangerous territory, as losing $3,000 signals a broader trend shift from consolidation to renewed bearish momentum.
Ethereum Crash Analysis: Rejections at $3,200 Confirm Bearish Structure
The below chart highlights several key technical signals.
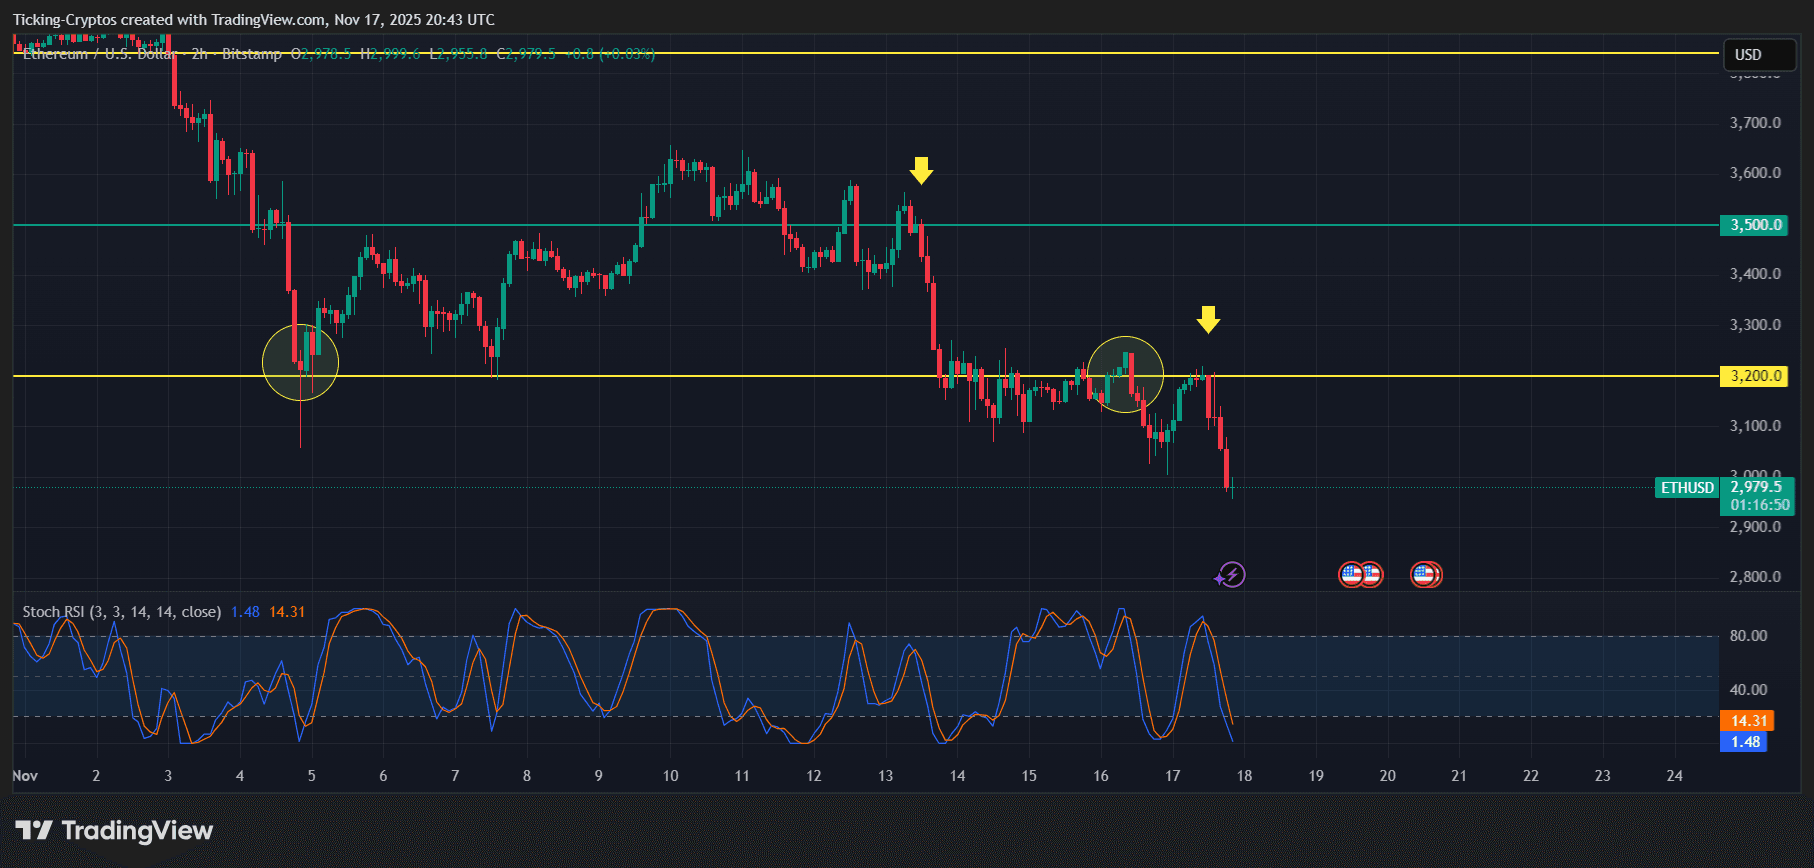
ETH/USD 2-hour chart - TradingView
1. The $3,200 Zone Was Tested Twice and Rejected
The yellow zone at $3,200 served as a major resistance:
- The first rejection occurred after a short-term bounce (yellow arrow on the left)
- The second rejection happened recently, marked again by a clear sell-off (yellow arrow on the right)
Each time ETH touched $3,200, sellers stepped in aggressively.
2. Fakeouts Around $3,200 Triggered the Breakdown
Both circled areas show ETH briefly poking above the level — but quickly falling back down.
Such fake breakouts are typical in bearish markets and often lead to steep drops.
3. Panic Selloff After Bitcoin Lost the 92K Mark
The last candles show heavy red momentum right after Bitcoin broke:
- First $95K
- Then $92K shortly after
This caused additional selling pressure on ETH, with the price collapsing straight through $3,000.
4. Stochastic RSI Is Resetting Lower — More Downside Possible
The Stoch RSI on the bottom:
- Shows a move from mid-range back toward oversold
- Indicates renewed downward momentum
Even though oversold ranges often bring bounces, in a crash environment the indicator can stay oversold for a long time.
Why This Drop Matters
Ethereum Has Officially Lost a Key Psychological Level
$3,000 is not just a technical support — it’s a major psychological threshold.
Breaking below it signals:
- weakening confidence
- increasing panic
- thin liquidity on the buy side
Bitcoin’s Crash Pulled ETH Down with Force
As seen earlier:
- BTC fell below $92K
Market-wide losses on 24h:
- $ETH: -3.55%
- $XRP: -3.83%
- $SOL: -5.21%
- $ADA: -4.55%
Ethereum followed the broader market and accelerated downward when BTC lost its support.
Next Possible Ethereum Targets
Based on the chart structure:
1. $2,900 — Current Zone
ETH is trying to stabilize around this area but showing weak volume.
2. $2,800 — Stronger Historical Support
This is the next major floor visible on longer timeframes.
Many traders will watch this level carefully.
3. $2,600–$2,700 Range — If Panic Accelerates
If Bitcoin continues its fall toward:
- $90K,
- or worse, $88K–$86K
ETH could quickly revisit the mid-$2,600 region.
Will Ethereum Recover Quickly?
Short answer: Not unless Bitcoin stabilizes.
Ethereum’s structure is currently bearish because:
- $3,200 rejected twice
- $3,000 broke cleanly
- Momentum oscillators turning down
- Bitcoin dominance rising during selloffs
A recovery is possible, but only if BTC forms a solid base above $92K again — which remains uncertain.