EOS Price Breakout: Is This the Start of a Major Bull Run?
EOS is starting to move again after weeks of silence! The charts are flashing green, and a breakout might be just around the corner.


EOS, a long-time favorite among altcoin enthusiasts, has shown a sudden surge in both price and momentum. After weeks of consolidation, the EOS price is now making headlines with bullish patterns forming across both short-term (hourly) and long-term (daily) charts. This analysis decodes whether the recent move is a fakeout or the beginning of a strong rally.
EOS Price Prediction: Is the Hourly Chart Flashing a Short-Term Reversal?

The EOS/USD hourly chart presents a textbook bullish breakout. Starting with the Heikin Ashi candles, we see a clear shift from indecisive red-blue sequences to solid green candles with minimal lower wicks — an indication of strong intraday bullish momentum.
The Moving Average (MA) Ribbon, which consists of the 20, 50, 100, and 200-period simple moving averages (SMA), shows a classic bullish crossover setup:
- The 20 SMA ($0.599) has cleanly crossed above the 50, 100, and 200 SMAs, signaling upward pressure.
- Price action has now broken well above the entire MA ribbon, currently trading at $0.6362, suggesting that buyers have regained full control.
Another critical observation is the Accumulation/Distribution Line (ADL), which continues its downward slope, a divergence from price. While this might raise eyebrows, it often represents late accumulation where price moves first before on-chain volume catches up. If ADL flattens or ticks upward in the next few sessions, it could confirm strong underlying buying.
This chart signals a strong near-term bullish reversal, potentially heading toward testing resistance levels near $0.66 to $0.70.
---> Click here to Trade EOS with Bitget <---
Does the Daily Chart Confirm a Macro Trend Reversal?
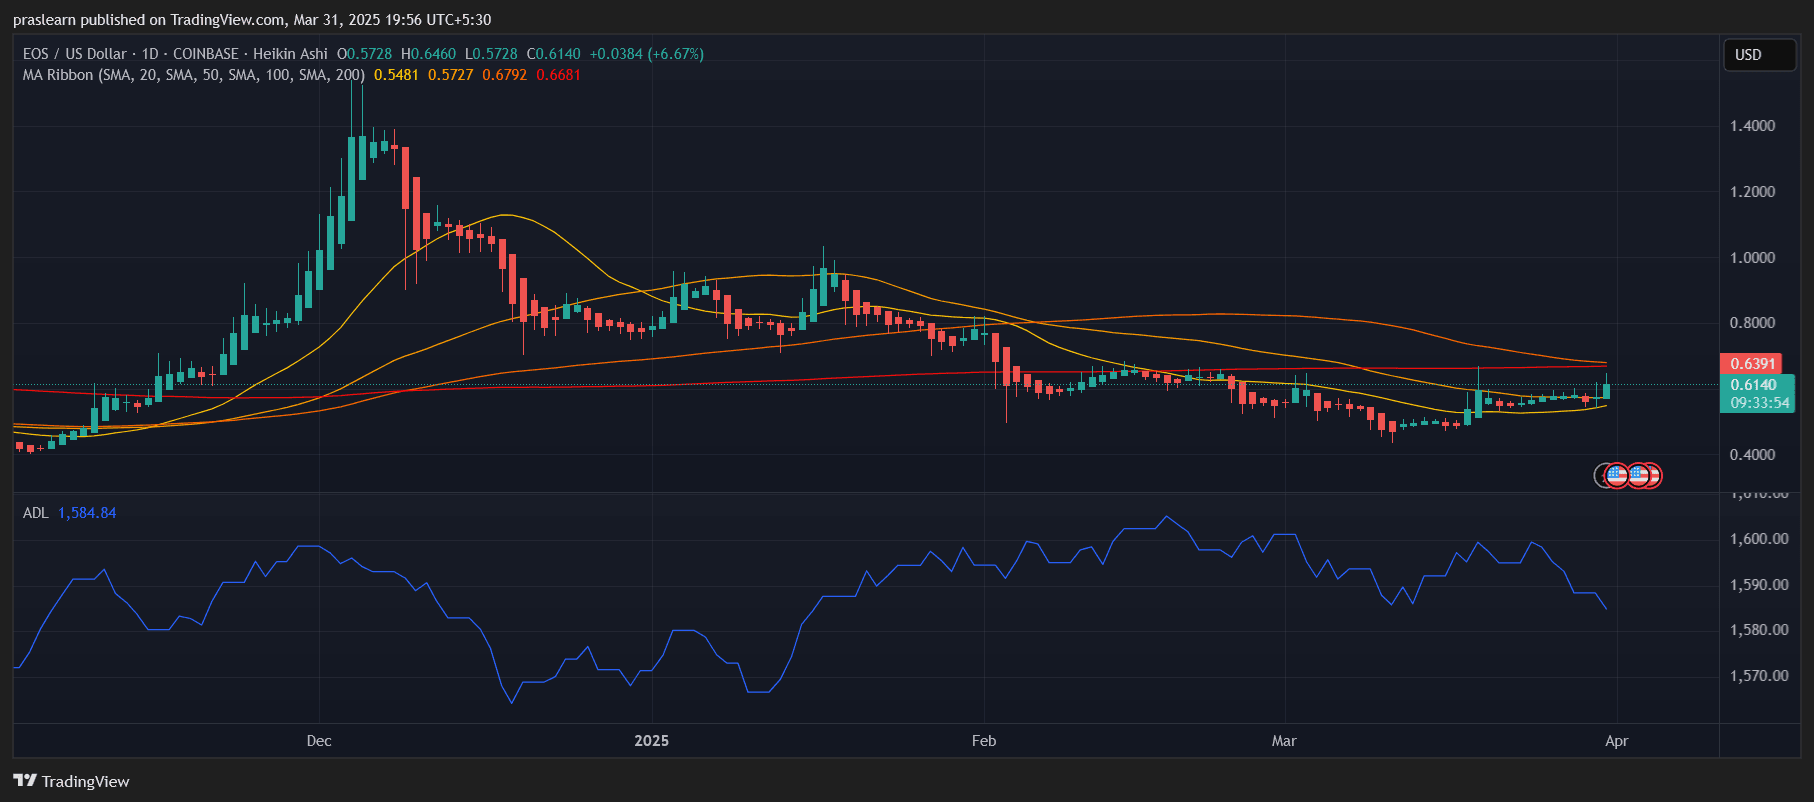
On the daily EOS/USD chart, a deeper narrative unfolds. EOS price had been in a downtrend since the December 2024 high around $1.40, but that bearish momentum has weakened over March 2025.
Now, things are shifting:
- EOS closed today up 6.67%, touching a high of $0.646, and is currently trading at $0.614 — decisively above the 20-day SMA ($0.5481) and inching above the 50-day SMA ($0.5727).
- This is significant because it’s the first break above the 50 SMA in over two months, hinting at a mid-term trend change.
However, two upper resistance layers remain — the 100 SMA ($0.6792) and 200 SMA ($0.6681). The area between $0.66 and $0.68 will be a strong supply zone. A breakout above that zone with volume would likely push EOS into price discovery toward $0.80 and beyond.
Interestingly, the ADL (Accumulation/Distribution Line) on the daily chart is also showing a slight downtrend, though much less steep than on the hourly chart. This indicates that broader sentiment may still be cautious — a classic setup for a surprise breakout if volume floods in.
What Are the Key Indicators Saying?
Let’s break down the most relevant indicators used across both charts:
- Heikin Ashi Candles: Smooth out price noise, showing momentum shifts. Both charts now display strong green candles with minimal wicks — signaling trending conditions.
- MA Ribbon (SMA 20/50/100/200): On the hourly chart, short-term MAs are trending above long-term ones (bullish crossover). On the daily chart, price is trying to break above mid-term MAs, which is a key trend reversal signal.
- Accumulation/Distribution Line (ADL): Currently lagging but not invalidating the uptrend. If this starts to rise alongside price, it will act as confirmation of real buying pressure rather than just speculative pumps.
---> Click here to Trade EOS with Bitget <---
Where Is EOS Price Heading Next?
Given the alignment of hourly breakout and daily resistance testing, EOS price could be entering a transitional phase from accumulation to markup. If it breaks above the $0.66–$0.68 resistance zone, the path to $0.75 and even $0.85 opens up quickly.
However, rejection at these levels could bring a short-term retracement back to the 20-day SMA at $0.548. This would still maintain bullish structure unless the price collapses below $0.52.
EOS Price Prediction: Bull Trap or Breakout?
EOS price is currently at a technical inflection point. The hourly chart supports a short-term breakout, while the daily chart cautiously leans bullish. Volume and on-chain accumulation need to catch up to sustain this rally, but all early signs point toward a legit breakout attempt.
If EOS price can flip the $0.66–$0.68 zone into support, the bullish case becomes dominant. Until then, traders should watch volume closely and consider pullbacks to the $0.58–$0.60 range as potential re-entry zones.