Bitcoin Price Prediction: Key Levels To Watch After the Historic Gold Crash
Bitcoin price faces high volatility following a massive gold crash. We analyze BTC support levels and retracement targets for the 2026 market cycle.


The financial landscape has shifted dramatically as we close out January 2026. Following a historic rally where gold prices surged, the precious metal experienced a violent 8% collapse on January 30, sending shockwaves through the commodities and crypto markets. Investors are now watching the $Bitcoin price closely to see if "digital gold" can decouple from traditional assets or if it will follow the downward trend.
Market Reaction: The BTC and Gold Correlation
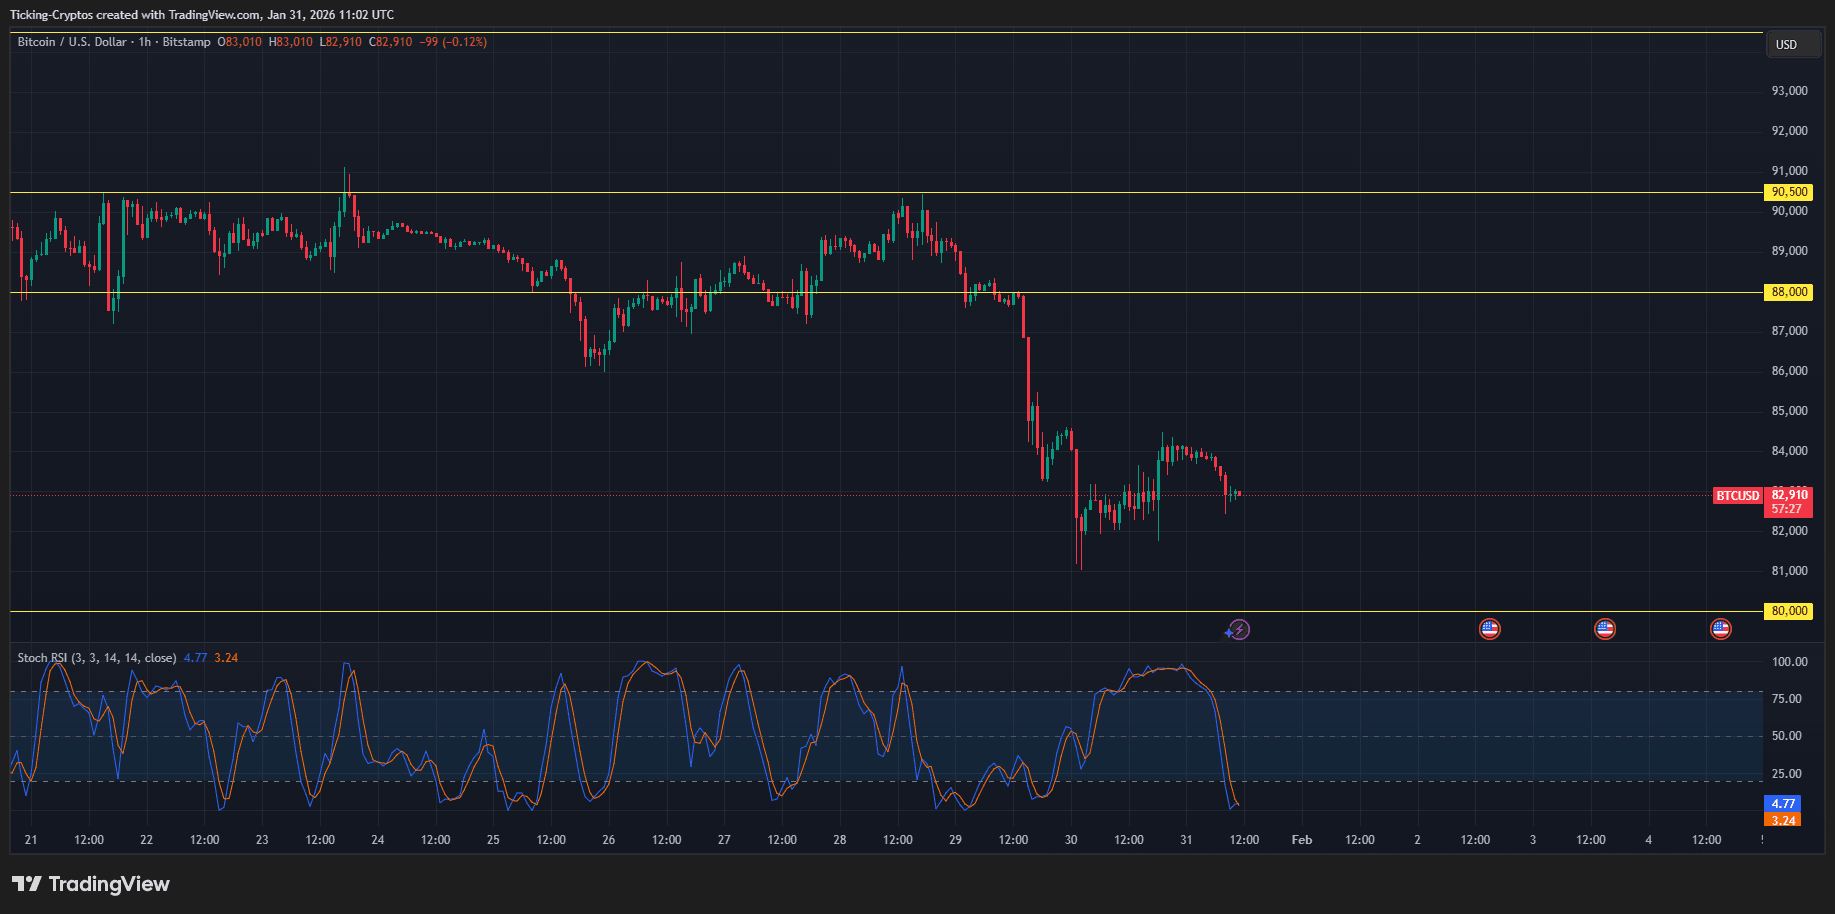
The recent drop in gold has created a liquidity squeeze across the board. As gold traders faced margin calls, many were forced to liquidate their more liquid crypto positions to cover losses. This has caused $BTC to slip below the critical $82,000 support zone, triggered by over $1.6 billion in liquidations.
According to the latest crypto news, several factors are contributing to this volatility:
- ETF Outflows: Spot Bitcoin ETFs saw a net exit of over $1.1 billion this week.
- Macro Shifts: Market uncertainty regarding future Fed interest rate hikes has strengthened the dollar, putting pressure on non-yielding assets.
- Profit Taking: After a strong start to 2026, many institutional players are rotating capital into defensive positions.
Future Areas Lower: Identifying the Bitcoin Bottom
If the bearish momentum continues, technical analysts are identifying specific "Value Zones" where the Bitcoin price might find its footing. The breakdown of the $85,000 level has opened the path for a retest of structural supports.
| Support Level | Type | Significance |
|---|---|---|
| $80,000 | Psychological | A major round number with high buy-order density. |
| $75,979 | Technical | The 200-day Exponential Moving Average (EMA). |
| $70,000 | Macro Support | A long-term consolidation zone from late 2025. |
A failure to hold $75,000 could result in a sharper capitulation toward $65,000. During such periods of high volatility, ensuring your assets are off exchanges is critical; you can check the latest hardware wallet comparison to secure your holdings.
Retracements Higher: Potential Recovery Targets
Despite the current carnage, the long-term outlook for Bitcoin remains bullish for many analysts. For a reversal to be confirmed, BTC must reclaim the 50-day Moving Average, currently sitting near $88,600.
- Resistance at $85,000: This former support level is now the primary ceiling for short-term price action.
- The $90,000 Rebound: Breaking back above this level would signal that the gold-induced panic has subsided.
- Target Zone: If stability returns, a retracement back toward the $97,000 mark is a realistic target by the end of Q1 2026.
Smart traders are utilizing crypto exchange comparisons to find the best fees and liquidity for these volatile moves. Major financial outlets like Bloomberg suggest that while the correlation with gold is currently high, Bitcoin's unique supply dynamics could lead to a faster recovery than traditional commodities.