YFI Price Poised For A Steeper Correction After Bearish Breakout
YFI price had one of the best crypto runs in history. The new and innovative DeFi project was listed on some of the best exchanges including Binance after a massive rally from low prices of down to $50 to an […]


YFI price had one of the best crypto runs in history. The new and innovative DeFi project was listed on some of the best exchanges including Binance after a massive rally from low prices of down to $50 to an amazing peak at $40,000.
YFI managed to reach a $1.2 billion market capitalization in just one month and a half of trading. The low circulating supply of only 29,968 is one of the most attractive features of the digital asset.
Yearn Finance Price Bearish Reversal
On the daily chart, the price of YFI has formed a clear head and shoulders pattern which is a reversal bearish indicator. The neckline was established at around $20,000 which was broken on October 3 and had some continuation the next day.
YFI/USDT Daily Chart – TradingView
The price of YFI is currently $19,580 after bulls have attempted to bounce back up, however, this doesn’t invalidate the bearish breakout.
In the short-term, the next price target for the bears could be $11,000. Before that, the daily RSI could get overextended and a dead cat bounce could happen. Nonetheless, bears are in full control right now.
Bulls will need to climb above $20,200 and see a lot of continuation to invalidate the head and shoulders breakout. The 12-EMA at $23,285 would act as a strong resistance level if the bulls can come on top.
It’s important to note that there was a huge spike in trading volume on October 4 after the bulls managed to push YFI above $20,000 from a low of $15,900.
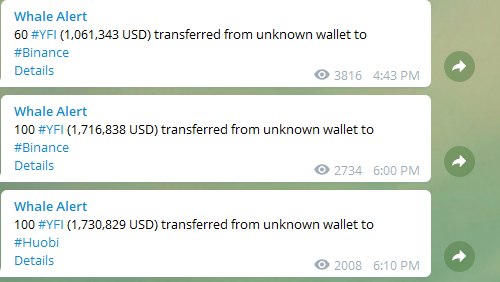
On the other hand, it seems that several YFI whales are sending their tokens to exchanges to either sell or get ready to sell. Both options signify an increase in selling pressure in the short-term.
Can YFI price Recover?
YFI/USDT 4-Hour Chart – TradingView
On the 4-hour chart, the outlook for YFI is a bit more positive with bulls setting a higher low at $17,500 compared to $15,993. If the price can establish a higher high above $20,249, the bulls would confirm an uptrend.
The 12-EMA has turned into a support level already and YFI is now aiming for the 26-EMA at $20,386.
The next few resistance levels are established at $21,487, at $24,792 and all the way up at $26,229.