Bitcoin Update – Stopped On The Way To $11,200 By The BitMex FUD!
The Bitcoin price reached $11,000, missing our $11,200 target by less than 2%. The sudden sell off yesterday came as a result of the BitMex FUD, fostering insecurity in investors. An additional albeit smaller sell off came this morning as […]


The Bitcoin price reached $11,000, missing our $11,200 target by less than 2%. The sudden sell off yesterday came as a result of the BitMex FUD, fostering insecurity in investors. An additional albeit smaller sell off came this morning as a result of Donald Trump testing positively for COVID-19.
Bitcoin Technical Analysis – Bitcoin’s last chance to remain bullish…
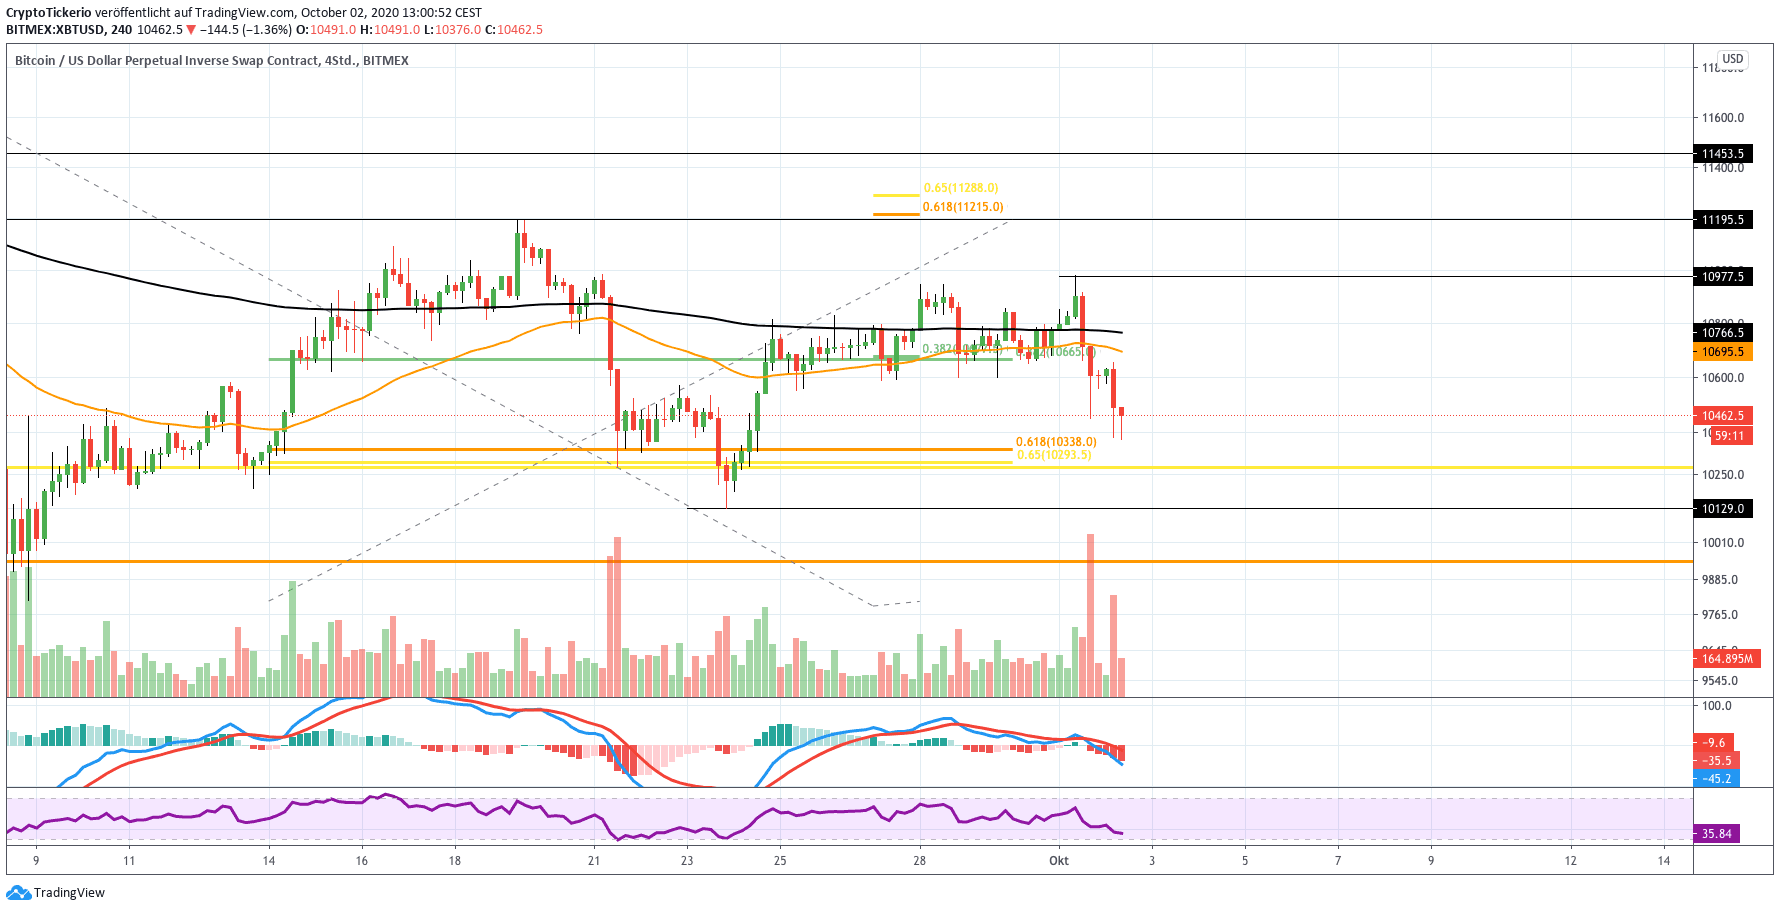
Yesterday the charts were looking very bullish, then the Bitcoin price started dumping as soon as news of the arrest of the BitMex co-founder and CTO started circulating on social media. Unfortunately due to this, the Bitcoin price was only able to reach $11,000 very briefly, and the cross over on the 4H charts never happened. Currently, BTC is on its way to the golden ratio at ±$10,350.
Bitcoin Technical Analysis – Daily MACD signals correction!
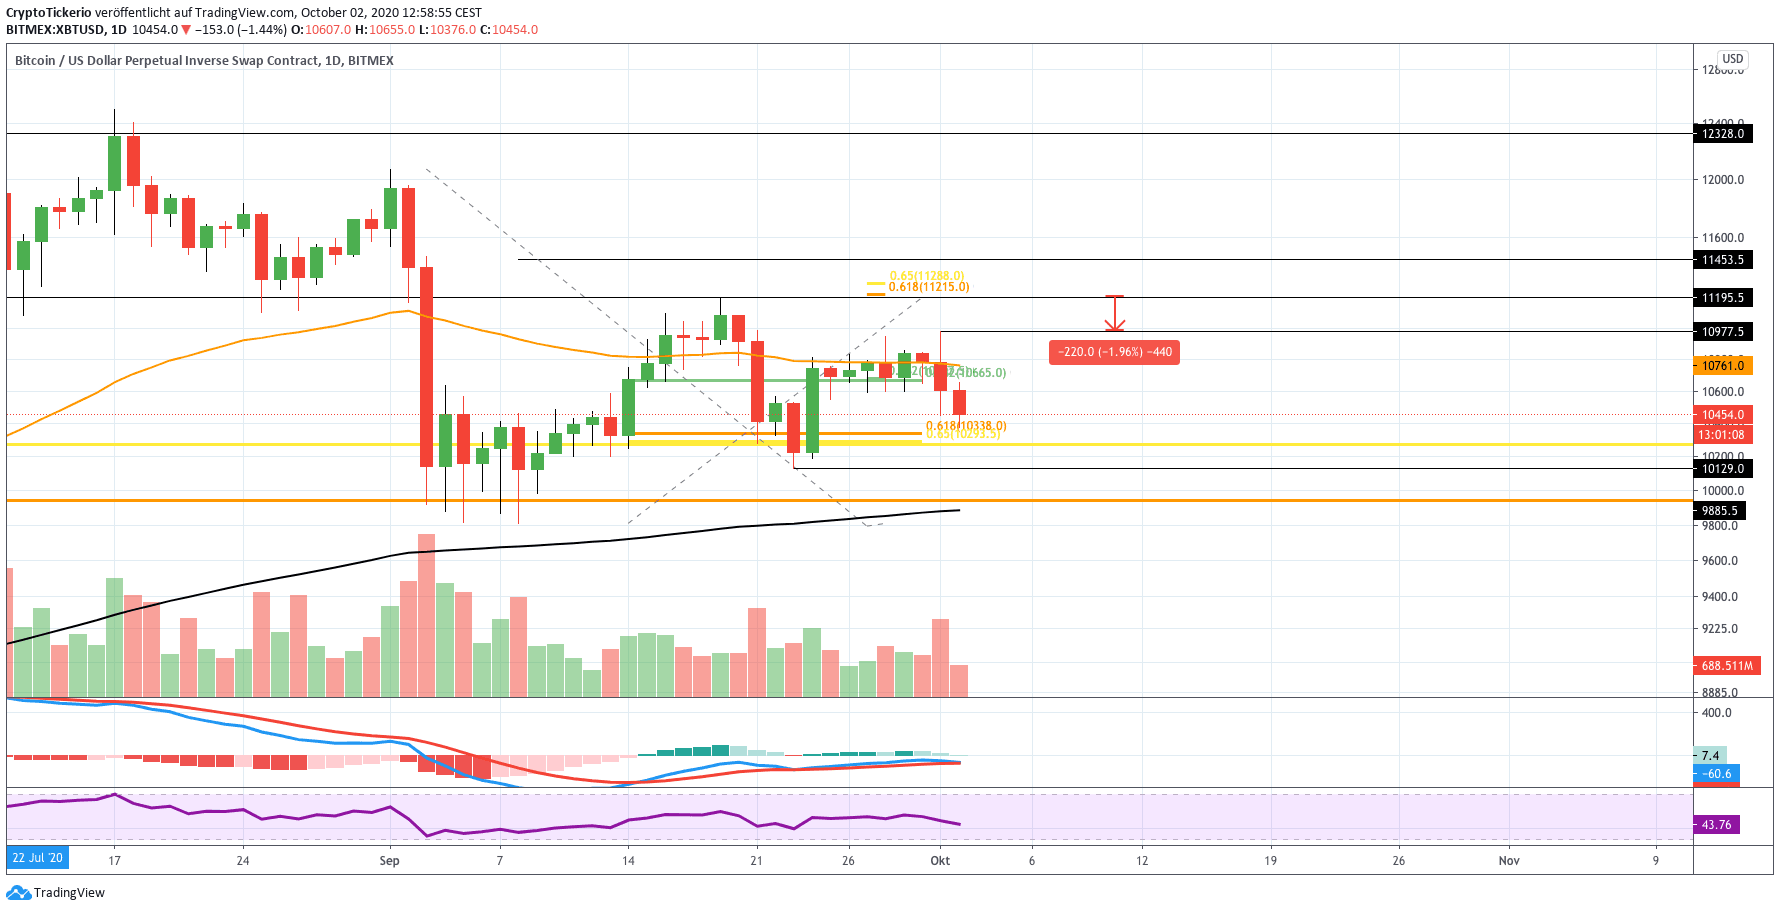
Due to this, Bitcoin formed a lower high, which is a bearish indicator. Bitcoin couldn’t break through the 50-Daily-EMA either, and as such the Bitcoin price could fall through the support between $9,900 – $10,350.
Should this be the case, the Bitcoin price might correct down to the support between $8,600 – $9,300, where Bitcoin could see a powerful rebound. The 200-Daily-EMA near $ 9,900 will serve as the last instance for Bitcoin to remain bullish.
The daily MACD is developing bearishly, and the MACD lines are crossed bearish once more, while the histogram is falling lower.
Bitcoin Technical Analysis – The weekly chart signals the continuation of the correction!
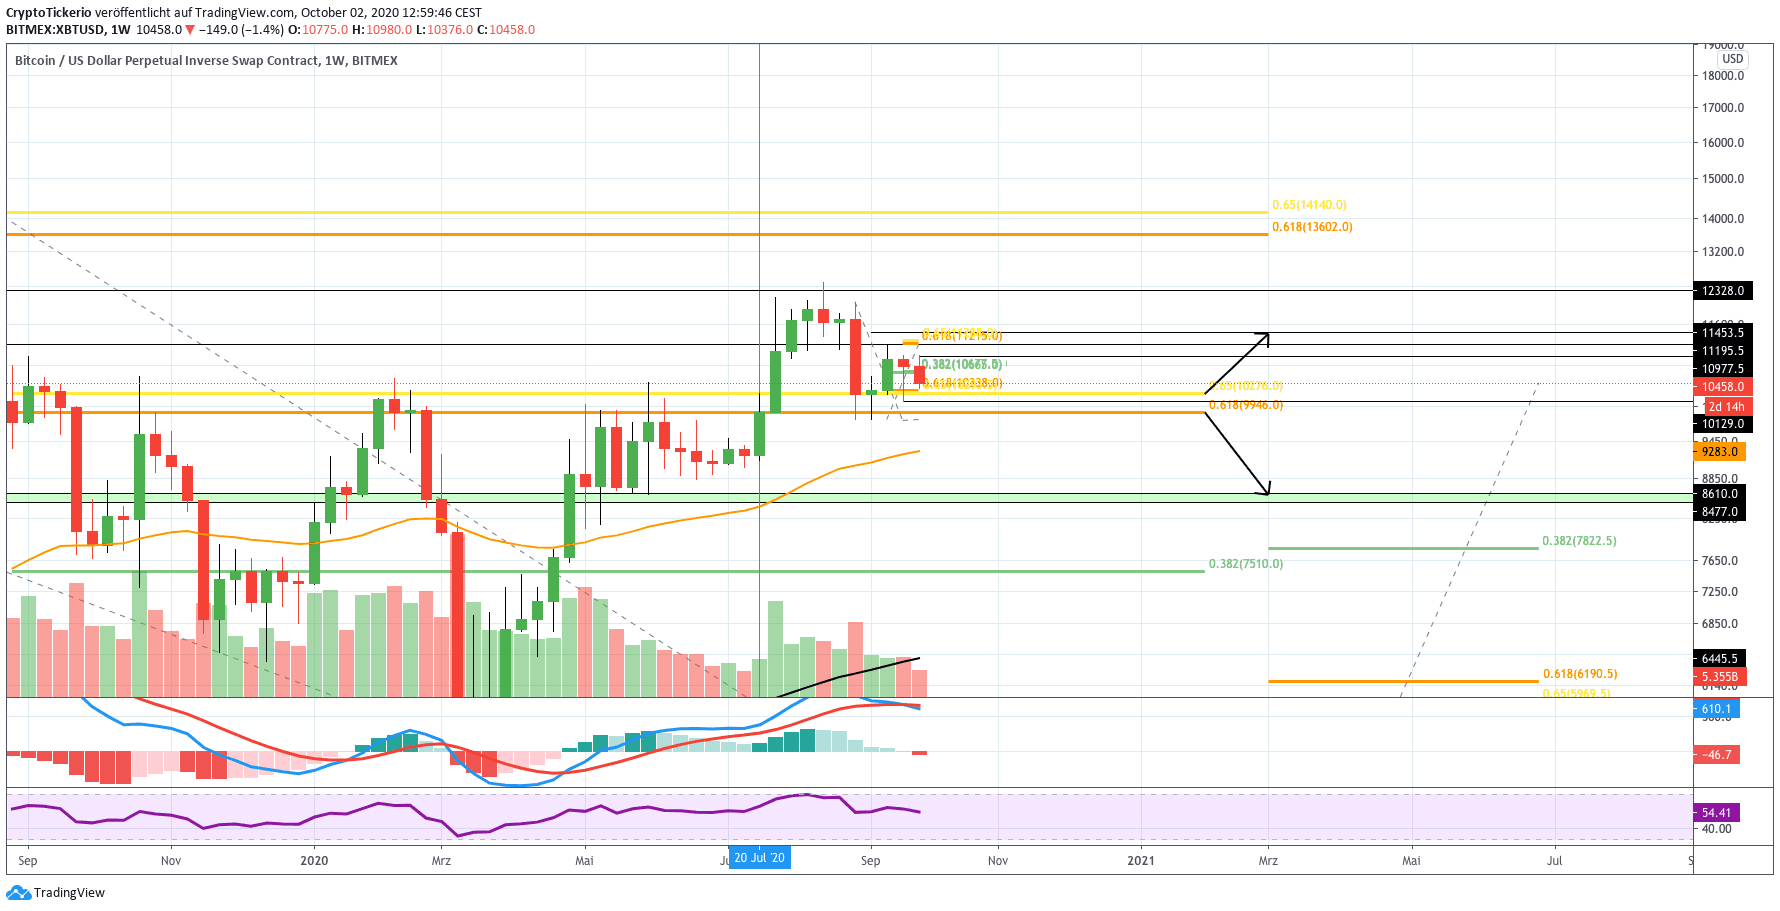
The MACD lines are bearishly crossing in the weekly chart as well, while the histogram continues to fall down bearishly. The 50-Weekly-EMA would come in as support around $9,300 should Bitcoin fall under the $9,900 – $10,350 range.
Should the Bitcoin price however gather itself at the support around the ±$10,000 mark, it should be able to rise again to the 0.382 Fib level at $10,650. And should this level be broken, it would find its next bullish targets between $11,200 – $12,500.
Bitcoin Technical Analysis – In the monthly chart a healthy correction looks to be shaping up!
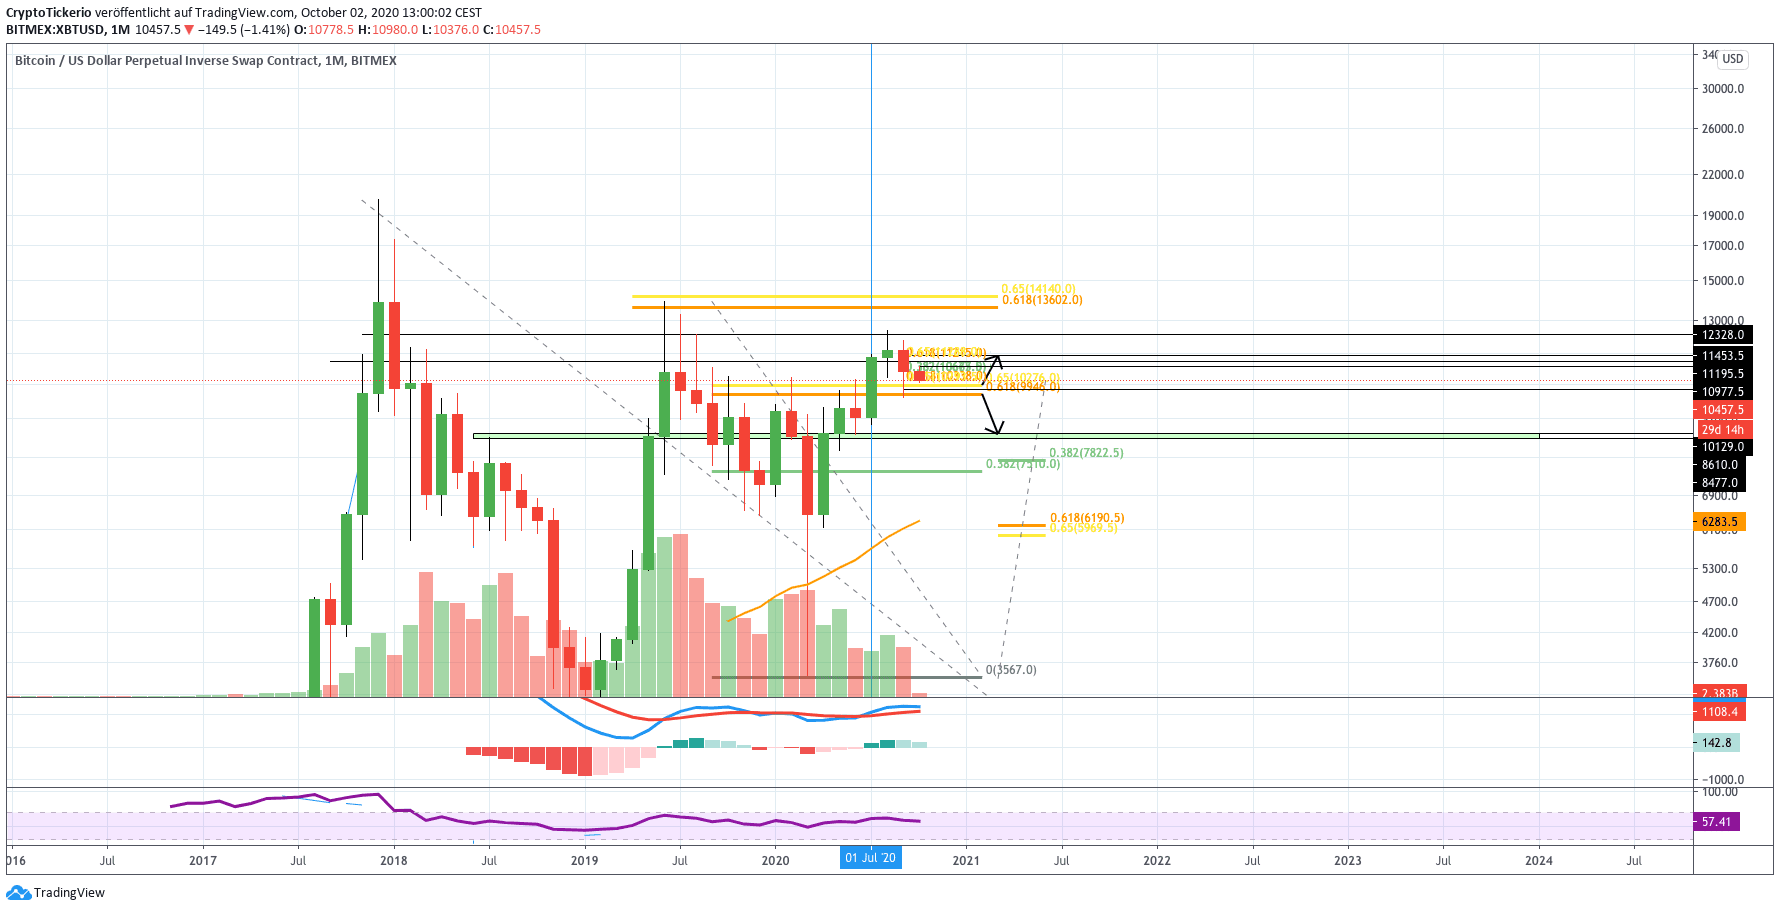
No bearish trend reversal is discernible in the monthly chart, as long as Bitcoin can defend the ±$10,000 mark. Should Bitcoin crash under it, and break below the $9,900 level, the MACD could form a bearish crossover here as well.
This could take the Bitcoin price down to $8,600 in the near future!
Best Regards and successful trades
Konstantin