Will Litecoin Crash to $0? Tariff War Triggers Brutal Selloff
With the market falling fast due to global tariff wars, LTC is in freefall. Can it recover, or is this the start of something worse?

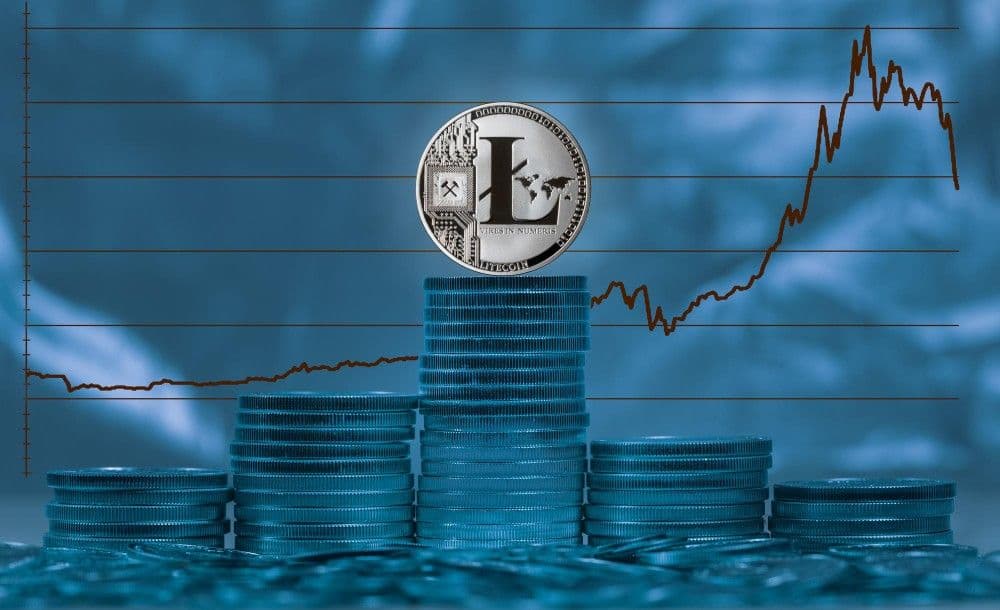
Litecoin (LTC), once called the “silver to Bitcoin’s gold,” is now facing a major existential crisis. As global markets nosedive due to rising tensions in the ongoing tariff wars, cryptocurrencies have not been spared. Litecoin price, in particular, has seen its price tumble violently, plunging from over $80 to as low as $63 in just a few days. With panic gripping traders and charts turning red, the question arises—is Litecoin headed for zero, or is this the final flush before a powerful reversal?
Let’s break down the technicals from both daily and hourly perspectives and examine what the indicators are screaming right now.
Litecoin Price Prediction: What Is the Daily Chart Telling Us About Litecoin’s Trend?
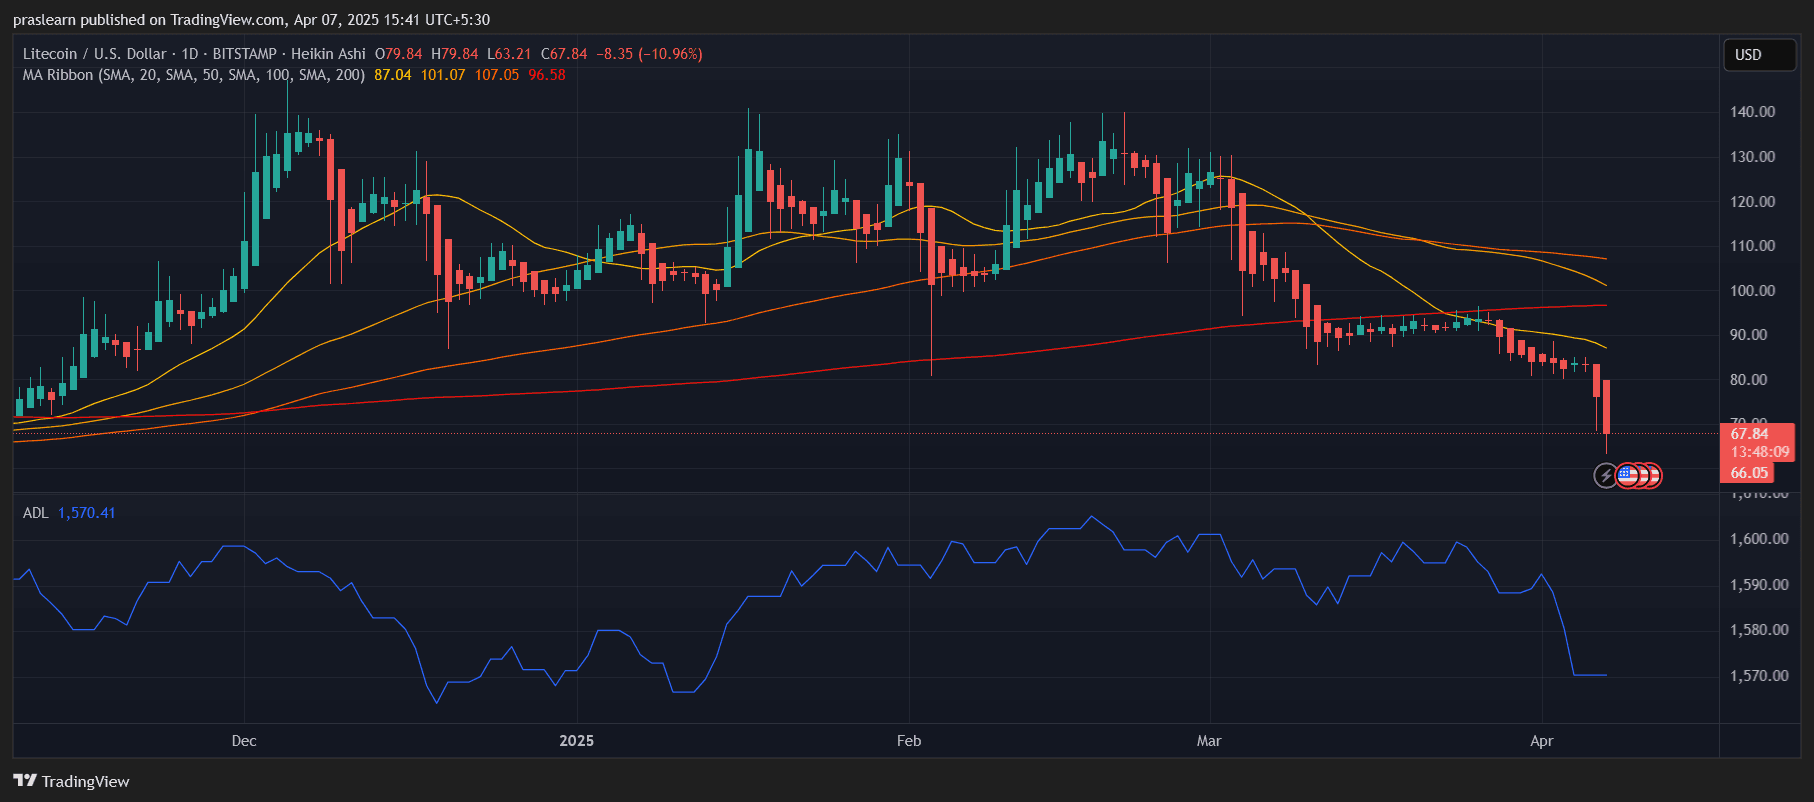
On the daily timeframe, Litecoin is in full freefall mode. The Heikin Ashi candles have turned solid red with long bodies and virtually no upper wicks, a textbook sign of strong bearish momentum. LTC has decisively broken below its key moving averages—20 SMA ($87), 50 SMA ($101), 100 SMA ($107), and 200 SMA ($96.5)—which were once stacked in a bearish order and now seem completely irrelevant as price plummets.
This 10%+ drop in a single day is not just volatility; it's fear-driven liquidation. The drop beneath the 200-day SMA has erased months of slow accumulation and shifted the market structure into a full breakdown. Support levels around $70 and even $65 failed to hold, with LTC hitting $63 before a small bounce.
More worryingly, the Accumulation/Distribution Line (ADL) has sharply dropped off. This means there's no whale accumulation happening. Institutions and large wallets are exiting—not buying the dip. This removes one of the key arguments bulls had left.
Does the Hourly Chart Show Any Signs of Life?

Looking at the hourly chart, there is a momentary pause in selling pressure—but not much else. Litecoin price has formed a few small-bodied Heikin Ashi candles around the $65 mark, hinting at temporary exhaustion from sellers. However, the overall trend is still firmly downward.
The 20, 50, 100, and 200 SMAs on the hourly chart are all curving downward and stacked in bearish order, with the 20 SMA currently at $70.42 and the 200 SMA far above at $82.40. Price is deeply disconnected from these levels, showing how stretched the current move is—but also how strong the downward momentum has become.
ADL on the hourly confirms this bearish bias, trending lower throughout the drop. While price has slowed, there’s no sign of fresh buying pressure. It's a classic "dead cat bounce" setup unless proven otherwise.
Where Are the Key Support and Resistance Levels?
Litecoin’s nearest support is now psychological and untested, with $60 acting as the next round level below. A break under $63 could bring a freefall toward $55–$50, and if macro panic persists, even $40–$35 is not out of the question.
On the upside, price would need to reclaim $72–$75 just to breathe. Any bounce below this level is likely to be sold into. A proper recovery would only begin above $80, and only if paired with rising ADL and strong volume.
Are the Indicators Showing Oversold or Still Bearish?
- Moving Averages: Completely bearish on both timeframes. All MAs are sloped downward, and price is far below them, suggesting continued downside or extreme volatility ahead.
- Heikin Ashi Candles: Strong red candles dominate both timeframes. No reversal wicks, no sign of trend change. This is still a selloff in progress.
- ADL (Accumulation/Distribution Line): Steep drop on both charts. This is critical—it shows that the dump is not retail panic alone but includes institutional unloading. Unless ADL flattens or climbs, a real recovery is unlikely.
Litecoin Price Prediction: What's Next for LTC in April?
- Short-Term Outlook (Next 48 hours): Expect a temporary stabilization around $65–$68, but another leg down toward $60 is highly possible if fear continues to rule. Watch for any hourly reversal pattern, though odds favor more bleeding.
- Mid-Term (Next 7–10 days): If the tariff war headlines continue to worsen and macro sentiment stays bearish, LTC price could retest $55 or even flash-crash to $50. Only a sudden reversal in volume or positive market-wide catalyst could spark a bounce.
- April Outlook (Rest of Month): The downtrend is firmly in place. If $60 breaks and there's no bounce recovery, LTC price might head toward $40–$45, revisiting zones from 2022–2023. A reclaim of $80 would be needed to shift bias neutral.
Final Thoughts: Will Litecoin Survive This Crash?
The charts are brutal, and the fundamentals are worse. Litecoin price has shown zero buyer support in the face of the current market panic triggered by global tariff wars. Unless a bullish macro shift or crypto-wide rebound kicks in soon, LTC could see lower prices not witnessed in years.
So, will Litecoin crash to $0? Probably not. But if sentiment doesn’t shift quickly, $40 might come before $100 ever does again.