This article is for informational purposes only and does not constitute financial, investment, or legal advice. Cryptocurrency investments carry high risk, so you should consult with a professional advisor.
Solana Crash Below $100 Triggers Massive Long Liquidations
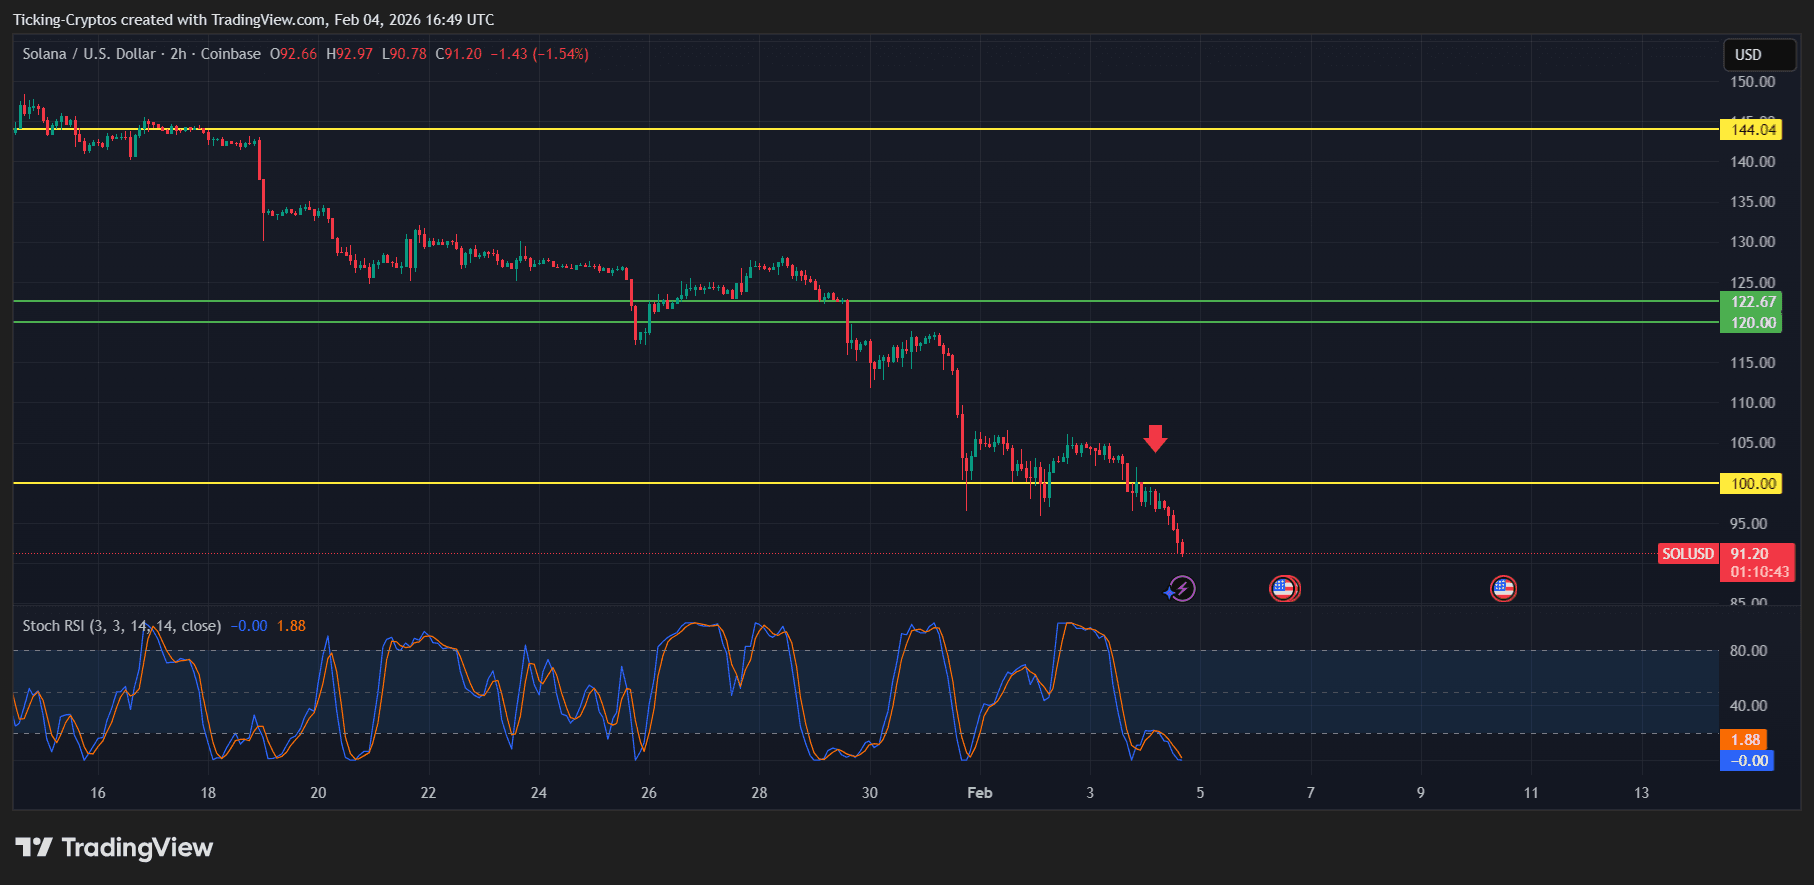
As of February 4, 2026, Solana (SOL) has decisively broken below the psychological $100 support level, marking its lowest price point in nearly a year.


Share:
Solana Price Analysis: The Anatomy of a Crash
The current price action os $Solana reveals a stark technical shift: what was once a rock-solid floor has now become a formidable ceiling.
- The Breakdown: After failing to sustain momentum near the $118–$120 supply zone in late January, SOL entered a freefall. The 2-hour chart shows the price currently fighting to stabilize near $95.72 after dipping as low as $93.38.
- Negative Funding Trap: Market sentiment is currently at an extreme. Data shows the OI-weighted funding rate has turned negative (roughly -0.0057%), meaning short-sellers are so aggressive they are actually paying long-holders to keep their bearish bets open.
- Oversold Signals: On the 2-hour timeframe, the Stochastic RSI is buried at 6.38, deep in oversold territory. While this suggests the selling pressure is reaching a point of exhaustion, any relief bounce will face immediate and heavy resistance at the $100.30 and $106.53 levels.
Why did Solaba Crash below $100
This crash isn't happening in a vacuum; it’s the result of a "perfect storm" of macro and ecosystem factors:
- Macro "Risk-Off" Sentiment: Broader markets are under heavy pressure, with Bitcoin sliding toward $75,000. The Crypto Fear & Greed Index has plunged to 14 ("Extreme Fear"), dragging high-beta assets like SOL down faster than the market average.
- ETF Outflows: For the first time since their high-profile launch, Solana spot ETFs recorded weekly net outflows of $2.45 million, signaling that institutional "smart money" is moving to the sidelines.
- Leverage Flush: The breach of $100 acted as a "tripwire." Of the total liquidations, nearly $24.7 million were long positions, creating a sell-side feedback loop that accelerated the drop to $93.
- On-Chain Divergence: Ironically, network usage is surging. Solana is currently processing over 3,700 TPS with a TVL of $9.3 billion. However, the market is currently ignoring these fundamentals in favor of liquidating over-leveraged traders.
Solana Price Prediction: Where Does the Slide Stop?
With $SOL struggling to maintain its footing in the mid-90s, the market is looking for a macro bottom.
Downside Targets (Bearish)
- Immediate Support: $90.00 - $92.00. This is the primary weekly demand zone. If this fails to hold on a daily close, the "crash" narrative will likely intensify.
- Macro Floor: $78.93. This represents the January 2024 trough. Analysts warn that a failure at $90 opens the door for a 20% slide to this final line of defense.
Upside Targets (Recovery)
- Target 1: $106.53. Reclaiming this level (the 20-day EMA) is the first step to proving the crash was a "bear trap."
- Target 2: $122.67. A break above this resistance would be required to declare the trend officially reversed.