EOS Price Analysis: What’s Next For EOS Price?
The fluctuation in EOS price continues. Despite the big news of a partnership with Google, the EOS/USD price has gained only 8.85% in the last 7 days. At the time of writing this article on October 10, 2020, the EOS/USD price is […]


The fluctuation in EOS price continues. Despite the big news of a partnership with Google, the EOS/USD price has gained only 8.85% in the last 7 days. At the time of writing this article on October 10, 2020, the EOS/USD price is sitting at $2.69 (+2.18%), which is almost close to the price before the news. So, what’s next for EOS price? Let’s take a look at it in more detail.
EOS Price Analysis: EOS Price Has gained Almost 8.8% In The Last 7 Days
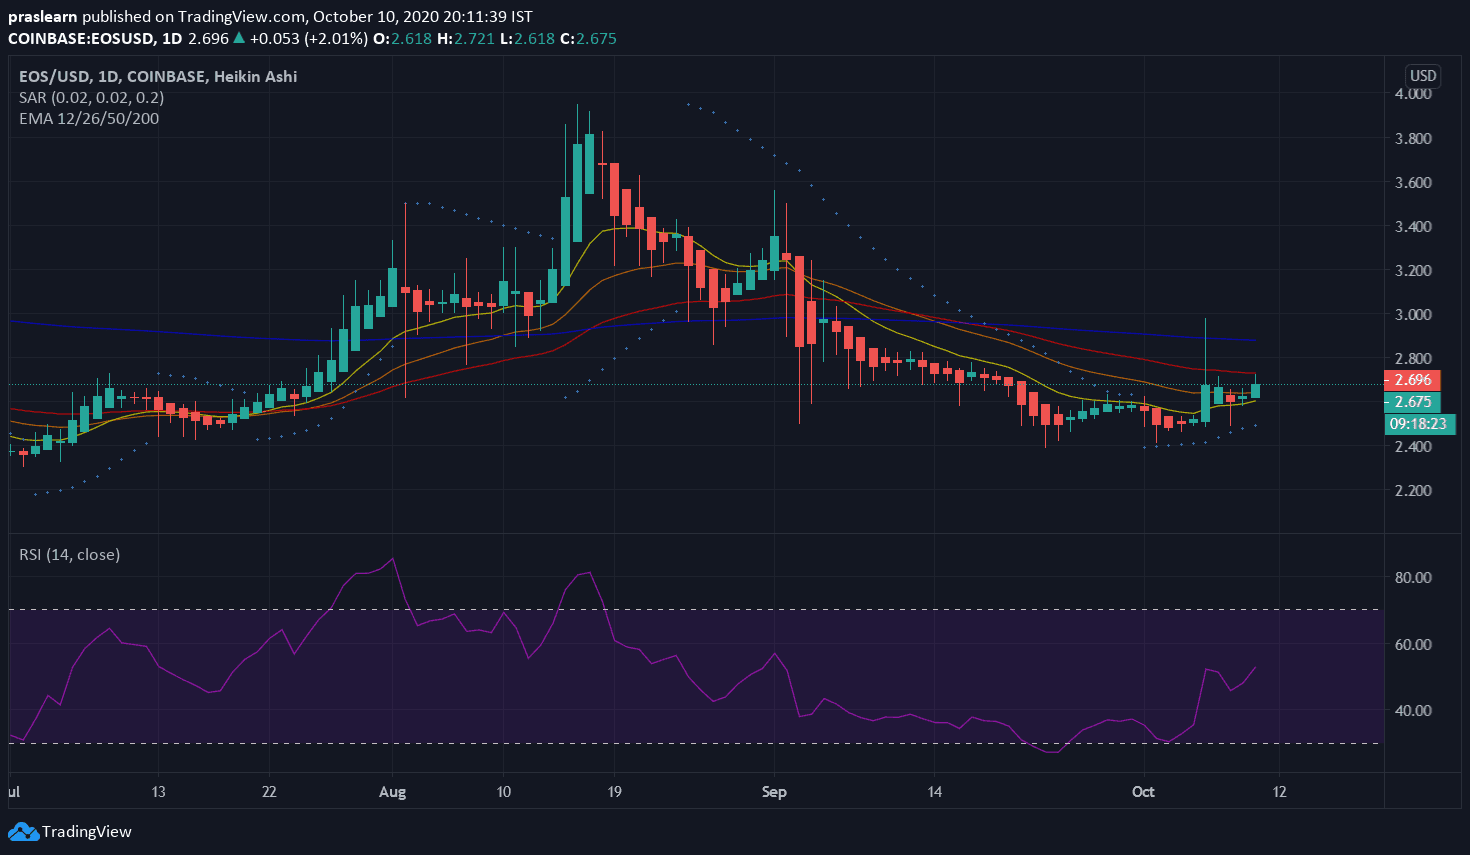
Now, if we observe the EOS price daily chart then it appears that bulls were not powerful enough to hold the coin above the 26-EMA except today. Just in the last 24 hours, the EOS price managed to hold the coin above 26-EMA. Now, if we see the other two EMAs then the EOS/USD price is way below the 50 and 200 EMAs.
This lazy movement could be displaying that bears are still implementing a lot of trading pressure and the daily downtrend could still be there if the important EMA is lost. The most significant short-term support level is also the 2.43 level covered on numerous occasions in the past. The EOS/USD daily Parabolic SAR could be still in a lazy zone. We can see that some dots have formed below the price and are slightly climbing in an upwardly tilted pattern, this could imply that the lazy movement could be there in the next few days.
EOS Price Analysis: What About EOS Price Weekly Chart?
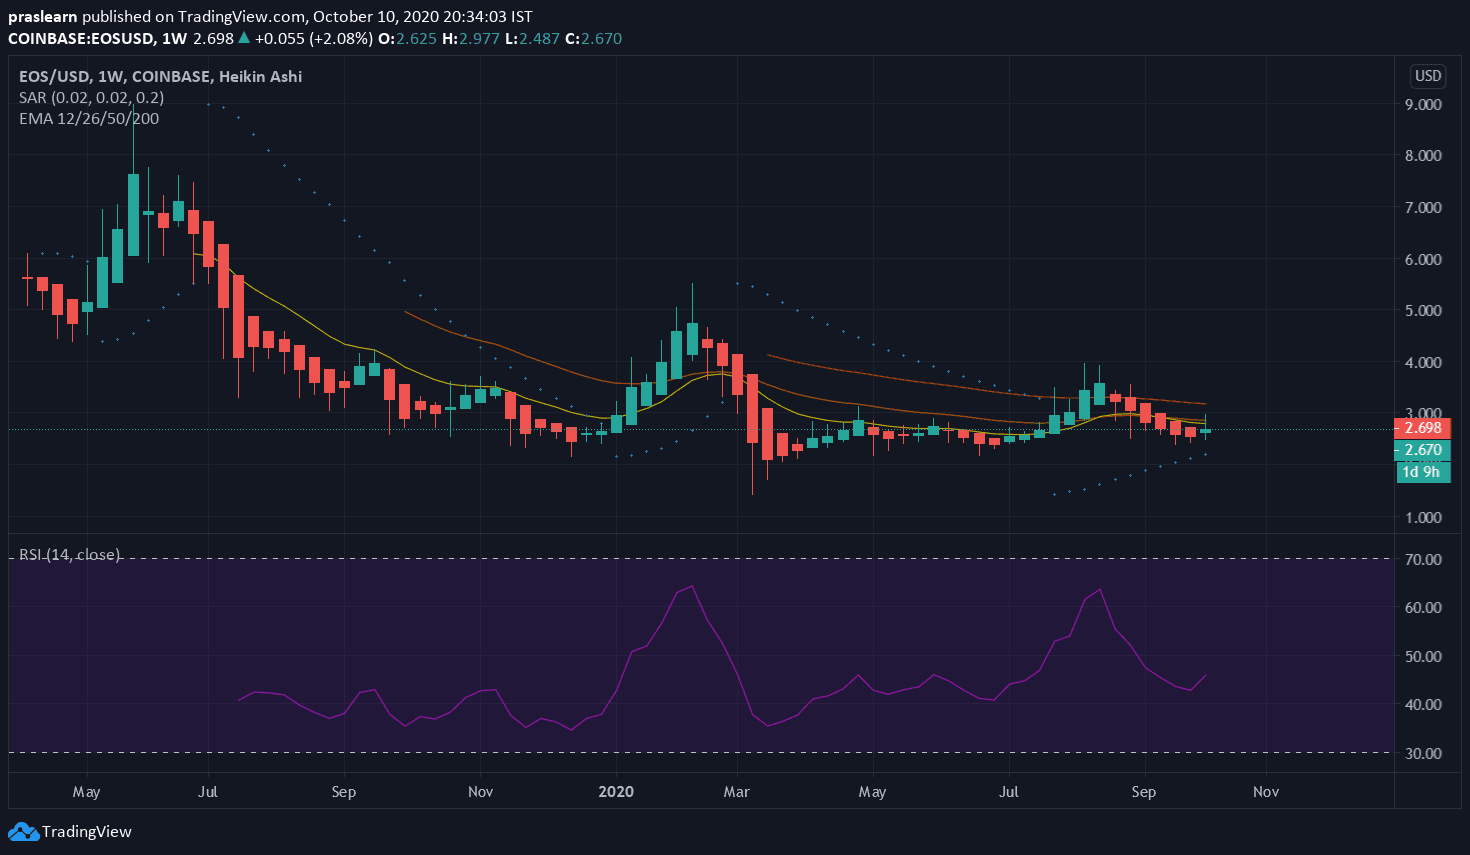
On the EOS Price weekly chart, the price could still not be able to stabilize above the 12-EMA at $2.76. Bulls may want to hold this support level if they want to see a rise towards the $2.97 high. The most critical resistance level could be sitting at the 50-EMA at $2.82. Now, it seems that price has failed to touch $2.81 and bulls need to touch this mark to display the strong momentum.
The EOS price weekly Parabolic SAR chart is just like the daily chart. It is also in the lazy zone and showing very dull momentum. We can see that some dots have formed below and the price and are climbing in an upwardly tilted pattern, this could imply a lazy uptrend for the EOS/USD price.
Conclusion
In the weekly chart, the EOS price still has ample space to increase. The RSI is in low regions while the MACD lines could be trying to cross and display a bullish behavior. The crucial thing to note here is that EOS is now close to its 12 and 26 EMAs in the weekly chart, which may serve as price limitation for the asset. The only positive thing for EOS price could be that price has increased in 17 out of the past 30 days and by almost 8.8% in the last 7 days. We wish you happy trading!