Chainlink Price Prediction: LINK jumps 7.6% to hit $10.67
The entire crypto market had a fantastic day, despite the uncertainty around the US presidential elections. The total market capitalization jumped from $392 million to a peak of $408 million in less than 12 hours. Chainlink was trading at $9.78 […]

The entire crypto market had a fantastic day, despite the uncertainty around the US presidential elections. The total market capitalization jumped from $392 million to a peak of $408 million in less than 12 hours.
Chainlink was trading at $9.78 before the massive spike towards $10.67 climbing above several resistance levels but still facing a crucial point at $10.72, the 200-SMA on the 4-hour chart.
LINK Price Analysis: Technical Indicators
On the daily chart, the price of LINK just climbed above the 50-SMA again, defending it as a support level. The MACD remains bearish but could quickly shift in favor of the bulls. The next price target seems to be $11.80 where the 100-SMA is currently located.
LINK/USD daily chart – TradingView
The most important pattern broken is the ascending triangle on November 2. As usual, it seems that the price of LINK will climb towards the lower boundary of the pattern to re-test it as a resistance level.
If the re-test is successful and the price gets rejected, the bearish downtrend will continue. If not, LINK could be eying up $13 again.
LINK/USD 4-hour – TradingView
On the 4-hour chart, bulls managed to push LINK towards $10.6 from an overextended RSI, however, they are still facing steep resistance at $10.72 where the 200-SMA stands. The MACD is on the verge of flipping bullish for the first time since October 31 and it could help the bulls.
If the critical resistance level at $10.72 is broken, the digital asset could very well jump towards $11.10 and $11.33 in the short-term.
LINK Price Analysis: On-chain Metrics
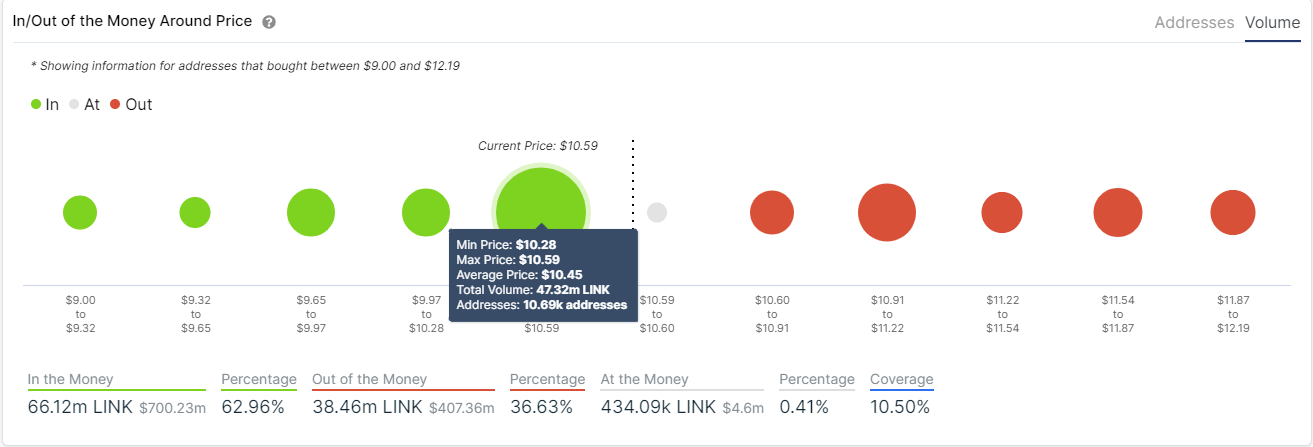
The IOMAP chart which shows how many addresses bought LINK coins at a specific price point, indicates that the digital asset is facing very little resistance until $12. It seems that the range between $10.28 and $10.59 represents a robust support area while there are no significant resistance areas above.

On the other hand, it seems that the number of new addresses joining the network has increased by 2.4% in the past 7 days. Additionally, the number of active addresses also rose by 1.2% in the same time period.
Nonetheless, it’s important to note that Chainlink had a massive spike in these activities around August and September but has slowly declined ever since and doesn’t show signs of recovery just yet.


