BONK Price to Moon or Crash?
BONK is back in focus as price action tightens near key resistance. Will the meme coin break out to new highs or fizzle below $0.000018?


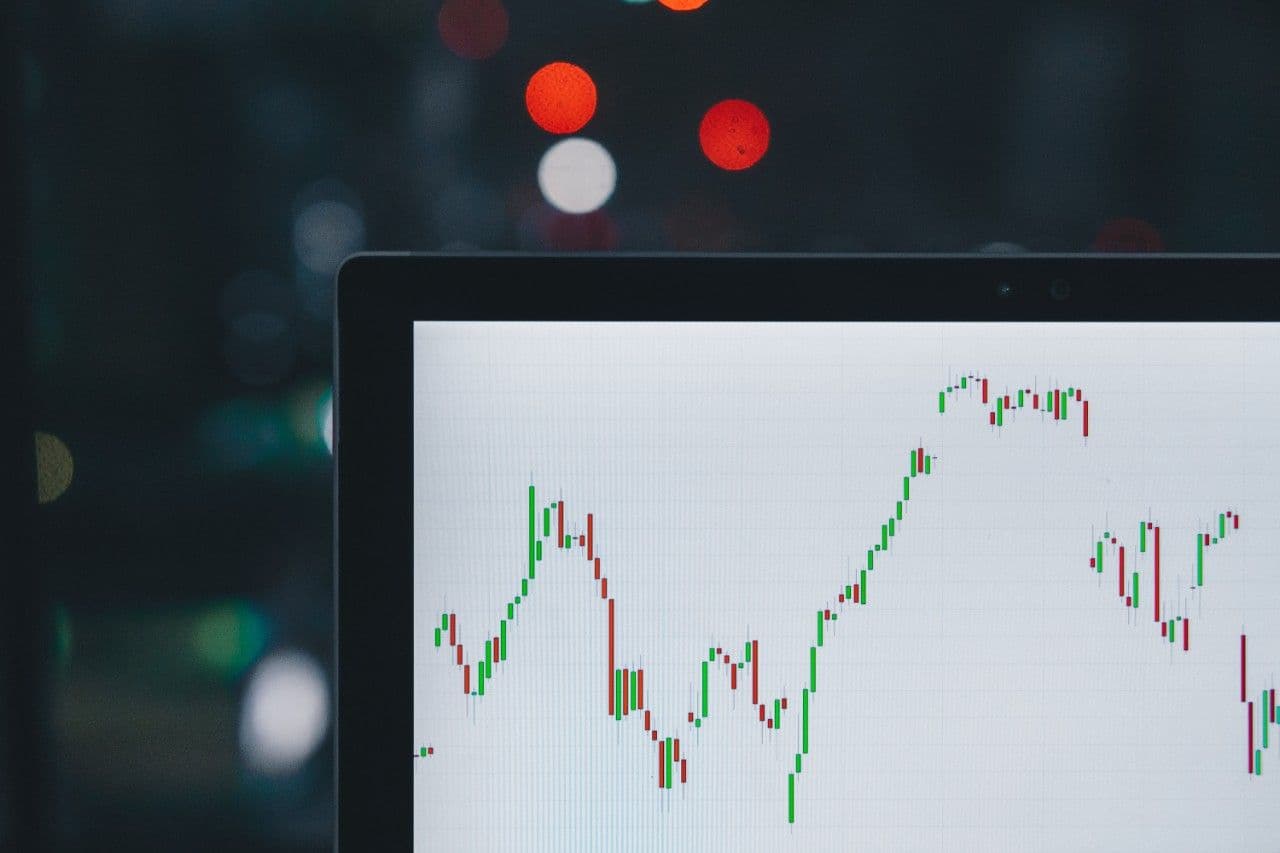
BONK, the Solana-based meme coin, continues to stir excitement across the crypto community. After gaining traction during the meme coin frenzy earlier this year, BONK's momentum cooled, leading to some sideways movement. However, with the recent shifts seen in the charts, traders are once again eyeing the coin closely. The big question is whether BONK coin is setting up for another leg higher or if the recent pumps were just a short-term burst. Let's break down the price action on both daily and hourly timeframes to see what may lie ahead.
Is BONK Gearing Up for a Bullish Breakout? (Daily Chart Analysis)

The daily chart shows BONK currently trading around $0.00001708. The price has steadily climbed since early April, forming higher lows, and is now testing a key resistance zone. What’s noteworthy is BONK’s ability to close above the 50-day and 100-day simple moving averages (SMAs), which now lie near $0.00001368 and $0.00001480, respectively. This crossover is a traditionally bullish signal and hints at growing strength.
However, the 200-day SMA looms overhead at approximately $0.00002397, which is acting as a longer-term resistance. The current price action has been slightly consolidative, forming what resembles a flag or pennant pattern—a classic continuation signal. If bulls can push BONK price above the $0.00001850 level in the coming sessions, we may witness a sharp move toward $0.00002100–$0.00002300 in a matter of days.
The Accumulation/Distribution Line (ADL) is rising steadily, which confirms buying interest. This bullish divergence between price and ADL supports the potential for a breakout continuation.
What’s Happening in the Short Term? (Hourly Chart Analysis)

On the hourly chart, BONK coin recently faced rejection at around $0.00001739 after trying to break above local resistance. The MA ribbon shows a bearish alignment as the price slipped back below the 100-hour SMA ($0.00001725) and is now hovering just above the 50-hour SMA.
What’s encouraging is that despite short-term volatility, BONK has formed a base above $0.00001650 multiple times—creating a reliable support zone. The price action has also shown multiple bullish engulfing candles near the $0.00001660–$0.00001680 area, indicating buyers are absorbing the dips.
Still, caution is warranted. A drop below $0.00001650 could lead to a short-term retracement toward $0.00001550 or even $0.00001500. But if BONK can reclaim the $0.00001750 level convincingly, the hourly trend could flip bullish, setting the stage for retesting $0.00001800–$0.00001850 soon.
Can BONK Price Rally Sustain Into Late May 2025?
If the broader crypto market remains stable and BONK price maintains its current trend above the 50-day SMA on the daily timeframe, there’s a strong chance it could revisit the $0.00002000–$0.00002300 zone in May. However, this rally is contingent on a breakout above the descending resistance line and consistent volume backing the move.
BONK’s popularity, meme coin appeal, and ecosystem activity on Solana can catalyze another rally. But without strong momentum or a clear breakout above current resistance levels, the coin might remain rangebound between $0.00001600–$0.00001800 for the next few days.
Will BONK Coin Fly or Stall Out?
From a technical standpoint, BONK coin shows promise on the daily chart with bullish crossover signals and improving ADL strength. Short-term resistance still poses a challenge, and the hourly chart reveals indecisiveness. A clear break above $0.00001850 would be the key signal to watch for a trend continuation toward $0.00002000+. Until then, traders should stay cautious, but hopeful, as BONK edges closer to another breakout moment.