Breaking: Bitcoin Crashes below $70,000 Sparking Lower Targets
Bitcoin price plunged below $70,000 today, hitting its lowest level since 2024. Was this just a fakeout? Let's analyze the key lower support levels.


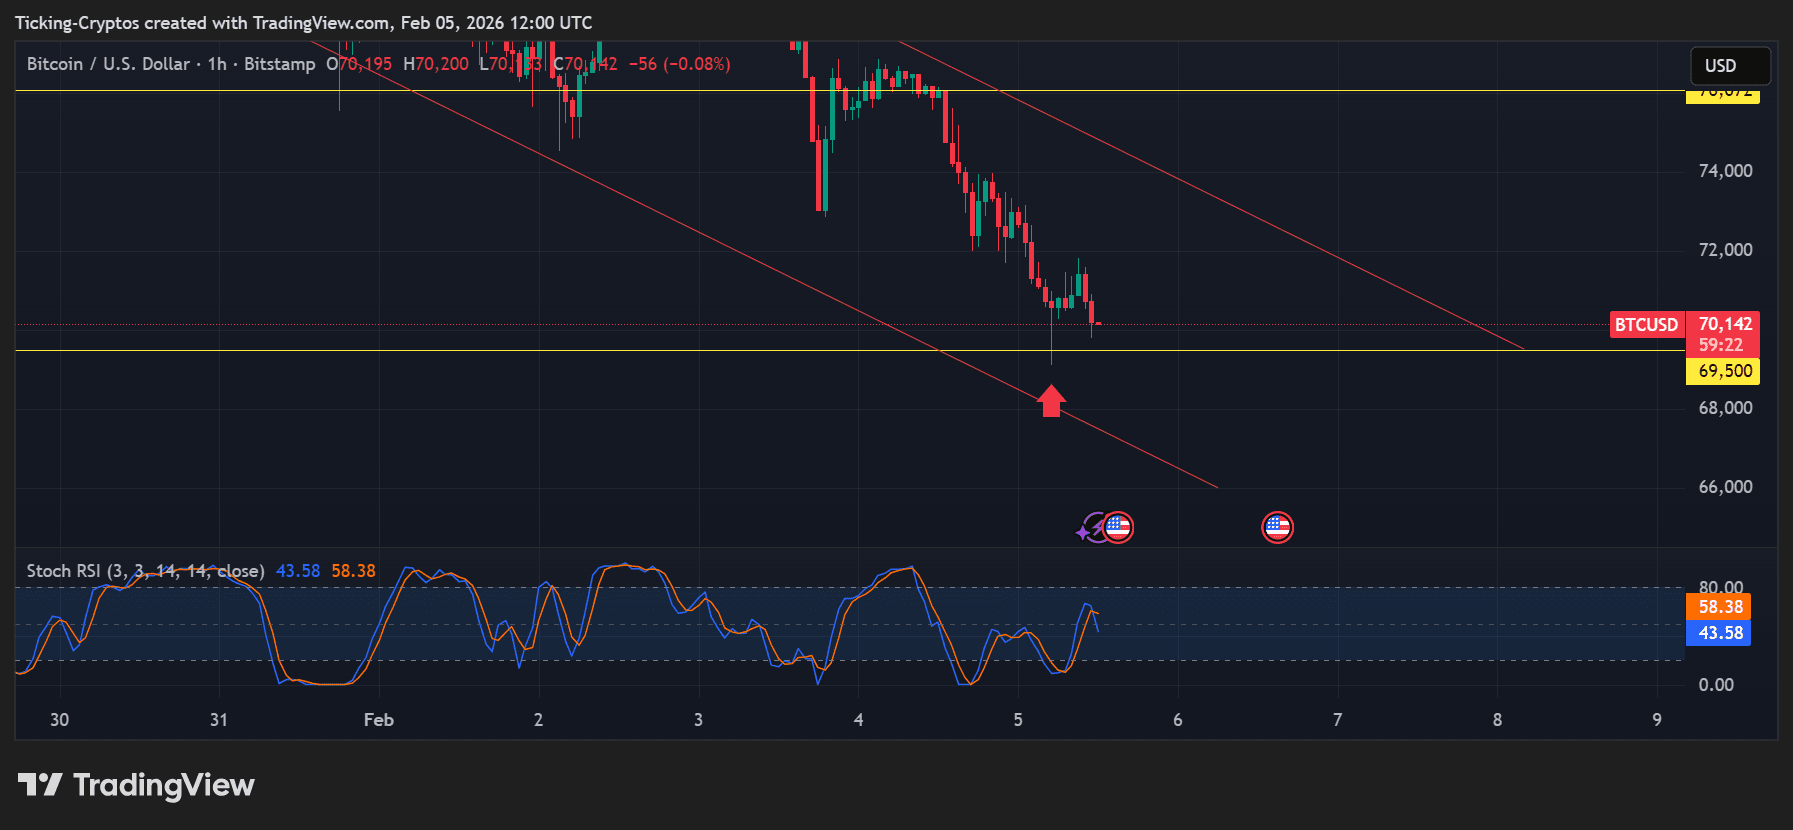
The cryptocurrency market faced a brutal session today, February 5, 2026, as Bitcoin ($BTC) crashed below the psychological $70,000 mark. The dip, which saw prices touch lows near $69,800, triggered nearly $775 million in liquidations across the market. However, a swift retracement back above the $71,000 level has left traders questioning if this move was a calculated "fakeout" to flush out over-leveraged positions.
Bitcoin Crash Analysis: Was the $70,000 Breach a Bullish Fakeout?
According to the latest BTC-USD price chart, today’s volatility suggests a classic liquidity grab. By briefly dipping below the heavy support at $70,000, Bitcoin managed to trigger stop-loss orders before moving back into a consolidation zone.
Technical analysts note that $70,000 remains a "line in the sand." If the daily candle closes above this level, it confirms that buyer demand remains strong despite the bearish pressure coming from institutional ETF outflows and a shifting macroeconomic landscape.
Macro Headwinds: Why is Crypto Crashing Today?
The sudden downturn is largely attributed to a "risk-off" sentiment in global markets. High-profile reports from Bloomberg highlight several key drivers:
- The "Warsh Effect": Expectations surrounding the next Federal Reserve Chair and a potential shrinking of the Fed’s balance sheet have dampened speculative appetite.
- Tech Sector Correlation: A broad sell-off in global technology stocks has spilled over into digital assets.
- Liquidity Crunch: Thinning liquidity in the spot markets amplified today's downward move, making the $70,000 breach feel more dramatic than a standard correction.
For investors looking to navigate this volatility safely, using highly-rated crypto exchanges with deep order books is critical to avoid excessive slippage.
Bitcoin Price Prediction: Where is the Bottom?
If Bitcoin fails to hold the current retracement, technical indicators point to a series of lower support levels where the price could find its next floor:
| Support Level | Analysis & Significance |
|---|---|
| $68,000 | Critical EMA Support: The 200-week Exponential Moving Average (EMA) sits here, often serving as the ultimate bottom in bearish cycles. |
| $65,000 | Psychological Cluster: A zone with high historical volume where "dip buyers" have traditionally stepped in during 2025. |
| $62,000 | Final Defense Line: This level marks a major Fibonacci retracement point. A break below this could signal a long-term bear market. |
Traders are increasingly moving assets into cold storage to weather the storm. You can check our latest hardware wallet comparison to find the best security options for your holdings.