Bitcoin Price Crash: Why BTC Fell Below $68,000 Today
Bitcoin price faces a sharp slump below $68,000 as a $14 billion options expiry and Middle East geopolitical tensions trigger a wave of liquidations.


After a brief attempt to stabilize earlier in the week, Bitcoin succumbed to a combination of heavy derivatives liquidations and escalating macroeconomic uncertainty. Investors are now questioning whether this is a temporary dip or the beginning of a deeper retracement toward the $60,000 zone.
Is Bitcoin Crashing?
To answer the immediate concern: Yes, Bitcoin is experiencing a sharp intraday slump. As of this morning, BTC fell as much as 4%, trading roughly between $68,100 and $68,700. This move has wiped out millions in leveraged long positions and shifted market sentiment into the "Extreme Fear" territory.
Bitcoin Price Analysis: Technical Breakdown
Looking at the BTC chart for March 27, 2026, we see a clear breakdown from the previous consolidation range.
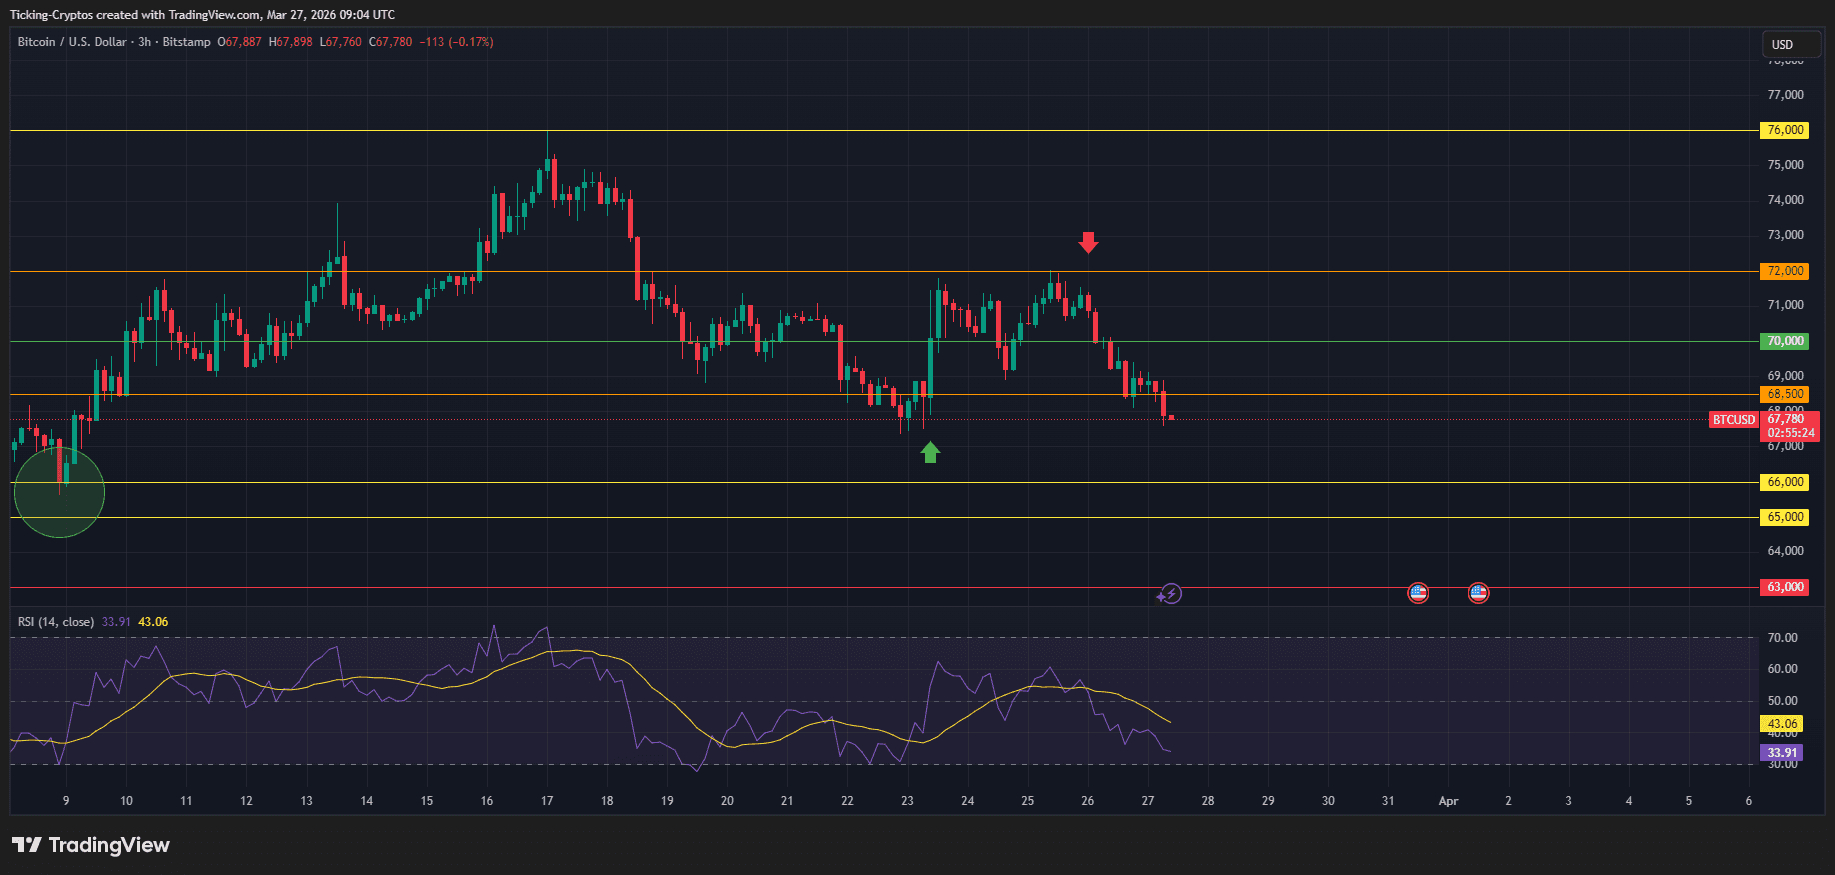
- Resistance Rejection: Bitcoin failed to maintain its position above the $71,200 zone, which has now turned into a formidable resistance.
- Trend Line Breach: The hourly chart shows a bearish trend line forming with immediate resistance at $70,050.
- Moving Averages: The price is currently trading well below the 100-hourly simple moving average (SMA), suggesting that sellers are firmly in control of the short-term momentum.
- Liquidation Zones: On-chain data indicates that a fall below $68,050 could trigger a massive cascade of cumulative long liquidations across mainstream exchanges, potentially totaling over $2 billion.
Why is Bitcoin Price Falling Today?
Several key factors have converged to create this downward pressure:
1. The $14 Billion Options Expiry
Today marks one of the largest quarterly options expiries of the year, with approximately $14 billion in open interest set to expire on Deribit alone. This "triple witching" style event often leads to increased volatility as market makers adjust their hedges (delta-hedging). With the "Max Pain" price sitting at $75,000, the current spot price of ~$68,500 puts significant pressure on long-position holders.
2. Geopolitical Tensions in the Middle East
The ongoing conflict in the Middle East continues to weigh heavily on risk assets. While there were brief hopes of a ceasefire, recent reports of US military movements and attacks on ballistic missile sites have reignited fears of a broader escalation. In times of extreme geopolitical uncertainty, Bitcoin—despite its "digital gold" narrative—often trades like a high-beta tech stock, falling alongside the Nasdaq 100.
 Tax season is right around the corner. Did you pick a crypto tax tool yet? Check out our comparison
3. Spot ETF Outflows
Institutional sentiment has cooled slightly. Recent data shows that US spot Bitcoin ETFs recorded a net outflow of $171 million in a single day. Without the consistent "institutional bid" that characterized the 2025 rally, the market is more susceptible to retail-driven sell-offs.
Liquidation Cascades
In the context of the current Bitcoin price slump, a "liquidation cascade" occurs when the price hits a level where many leveraged traders' "stop-loss" or "liquidation" points are clustered. When these positions are force-closed, the exchange must sell the BTC to cover the debt, which pushes the price even lower, triggering the next batch of liquidations.
Bitcoin Price Prediction: What’s Next for BTC?
If Bitcoin cannot reclaim the $70,500 level within the next few hours, analysts are eyeing a deeper correction.
- The Bear Case: A sustained break below $68,000 could open the doors for a retest of the $60,000 support, a level not seen since the February "flush."
- The Bull Case: If the options expiry passes without a total collapse, and we see a "Golden Cross" on the daily chart (where the 21-day SMA crosses the 50-day SMA), a relief rally toward $72,000 remains possible.