Bitcoin Price Analysis: Why Did BTC Coin Pump to $69,500 Today?
Bitcoin price surges toward $70,000 following a short squeeze and positive macro sentiment from the State of the Union address.


After weeks of grueling "Extreme Fear" and a steady decline toward the $60,000 mark, Bitcoin has reminded the market why it is the king of volatility. In a single 4-hour candle on February 25, 2026, $Bitcoin shot up by over 3%, breaking through multiple local resistance levels. This move has effectively invalidated the immediate bearish narrative that saw BTC pinned below $65,000 just hours ago.
What Caused the Bitcoin Pump?
The primary catalyst for today’s move appears to be a combination of macro-economic optimism and technical liquidations.
- The Trump Effect: President Donald Trump’s State of the Union address highlighted cooling inflation and record-low mortgage rates, which boosted risk appetite across the Nasdaq and S&P 500.
- The Short Squeeze: According to data from major exchanges, over $323 million in leveraged positions were liquidated in 24 hours. As short-sellers were forced to buy back their positions to cover losses, it created a feedback loop that accelerated the price upward.
Bitcoin Price Analysis: Breaking the $68,500 Ceiling
Looking at the 4-hour $BTC/USD chart from Bitstamp, we can observe several critical technical developments.
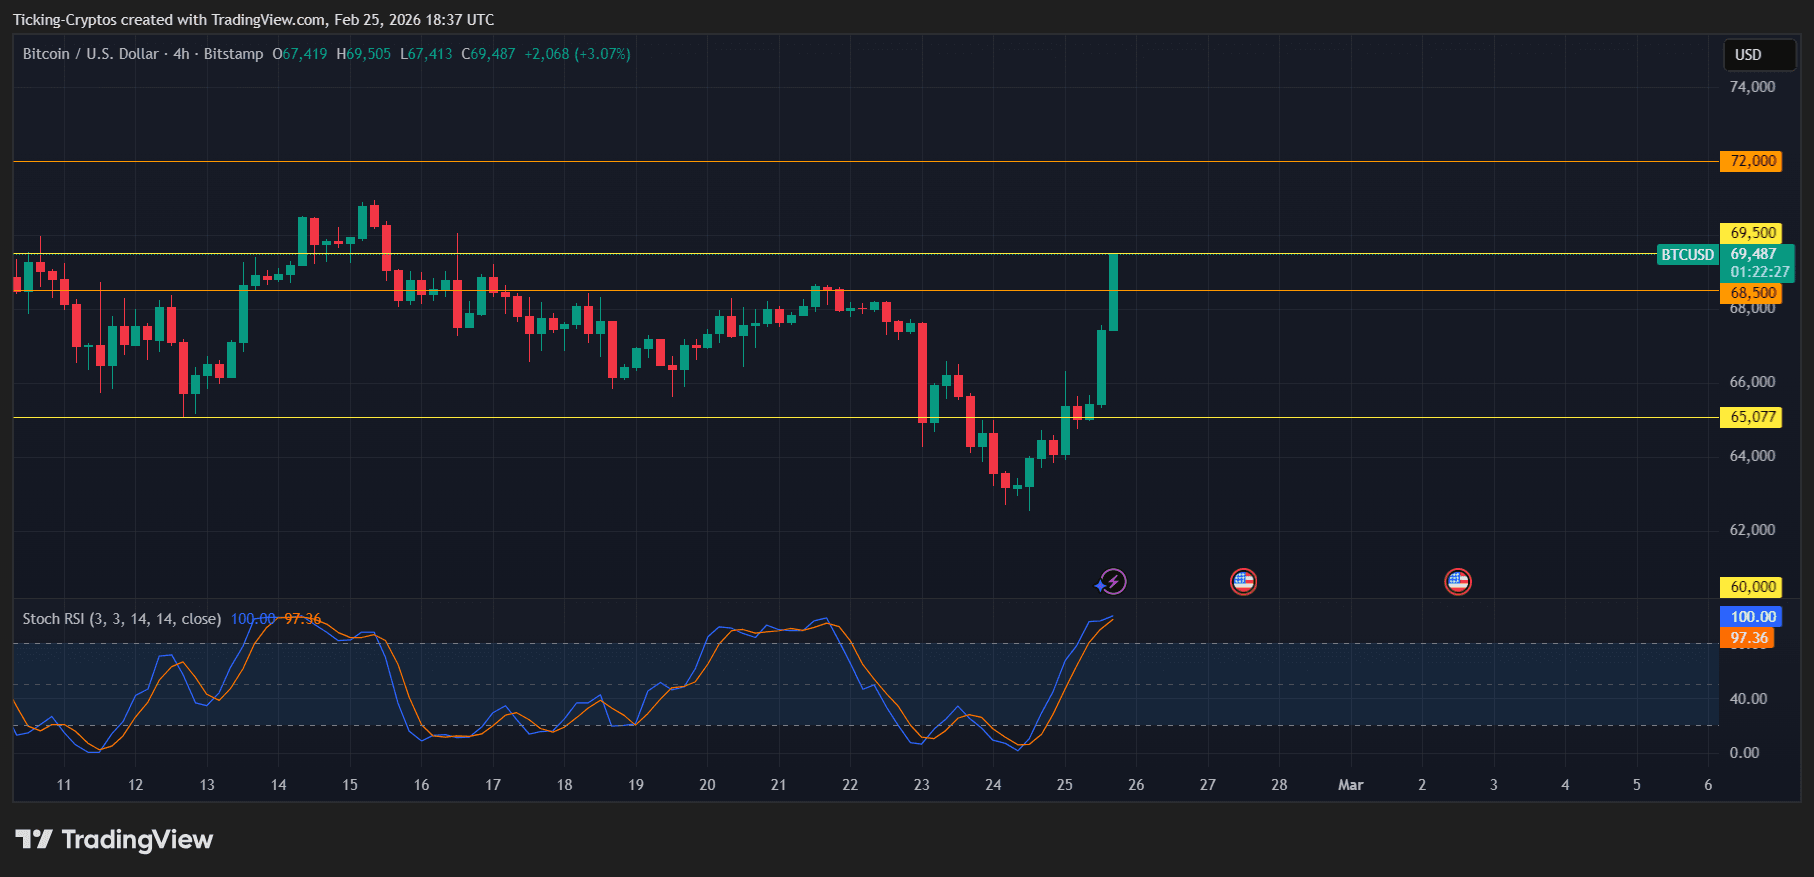
- V-Shape Recovery: The price bounced sharply off the $64,000 level, forming a local double-bottom structure.
- Resistance Flip: The previous resistance at $68,500 has been breached. For the bulls to maintain control, Bitcoin needs to close a 4-hour candle above this line to confirm it as new support.
- Stochastic RSI Overbought: The Stochastic RSI has reached the 100.00 mark. While this shows immense buying momentum, it also suggests that the rally may need a brief "cool-off" or consolidation period before attempting to break the major $72,000 resistance.
| Level | Type | Significance |
|---|---|---|
| $72,000 | Major Resistance | Yearly high target; heavy sell wall expected. |
| $69,500 | Local Resistance | Current battleground for bulls. |
| $68,500 | Immediate Support | Must hold to prevent a "fakeout" scenario. |
| $65,077 | Major Support | Psychological floor and recent bounce zone. |
 Crypto Exchange Check: Who is the Test Winner? Get the Most Out of Your Investment
What is a Short Squeeze?
In the context of today's price action, a short squeeze occurs when an asset's price rises unexpectedly, forcing traders who bet on a price drop (short-sellers) to close their positions. To close a short, they must buy the asset, which adds even more upward pressure on the price. This often results in the vertical "spikes" seen on the chart today.
Market Sentiment and ETF Inflows
Institutional interest remains a backbone for this recovery. U.S. Spot Bitcoin ETFs recorded a net inflow of $257.7 million on Tuesday, marking the highest single-day inflow since early February. This suggests that while retail sentiment was in "Extreme Fear," institutional "smart money" was actively buying the dip.
Bitcoin Prediction: Can BTC Hit $72,000?
The next 24 hours are crucial. If Bitcoin can flip the $69,500 level into support, the path toward the $72,000 target becomes clear. However, traders should watch for the upcoming nuclear talks between the US and Iran, as geopolitical tensions often cause "flight to safety" moves that can temporarily pull liquidity out of crypto and into gold.