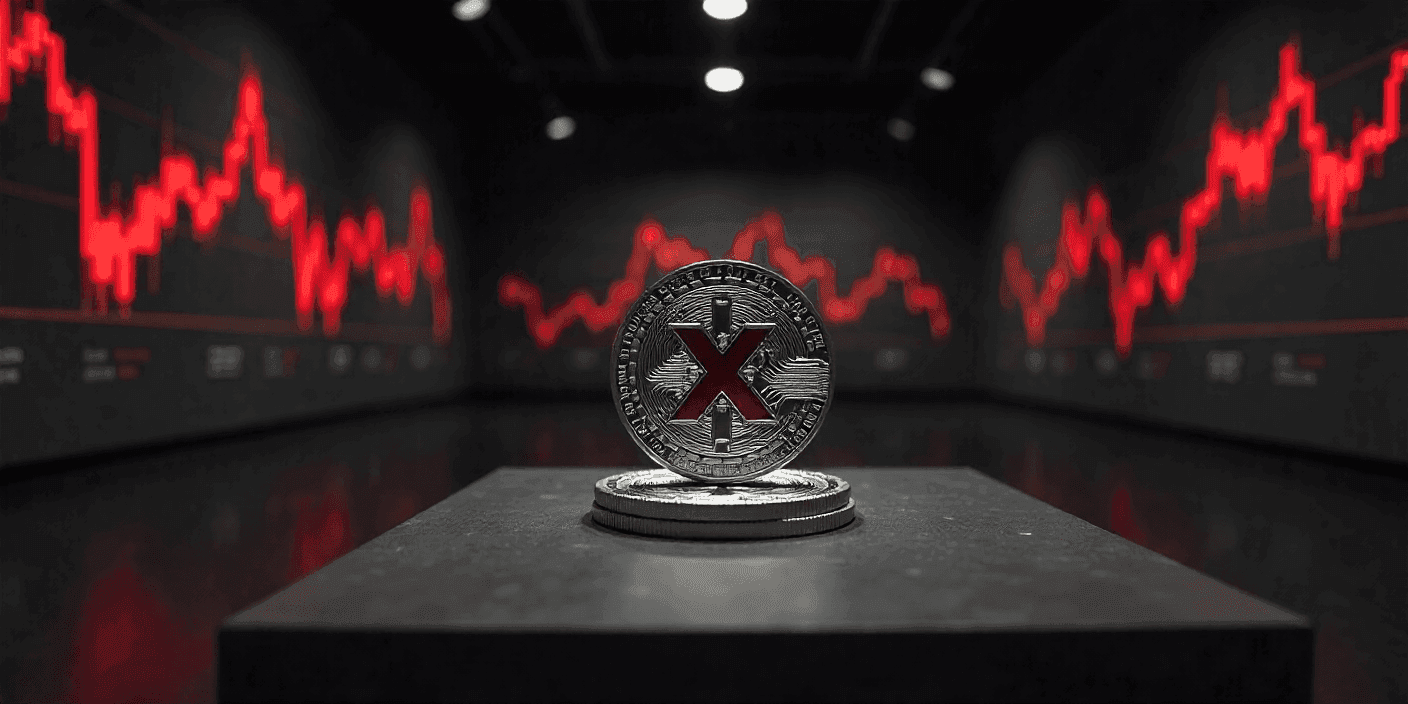
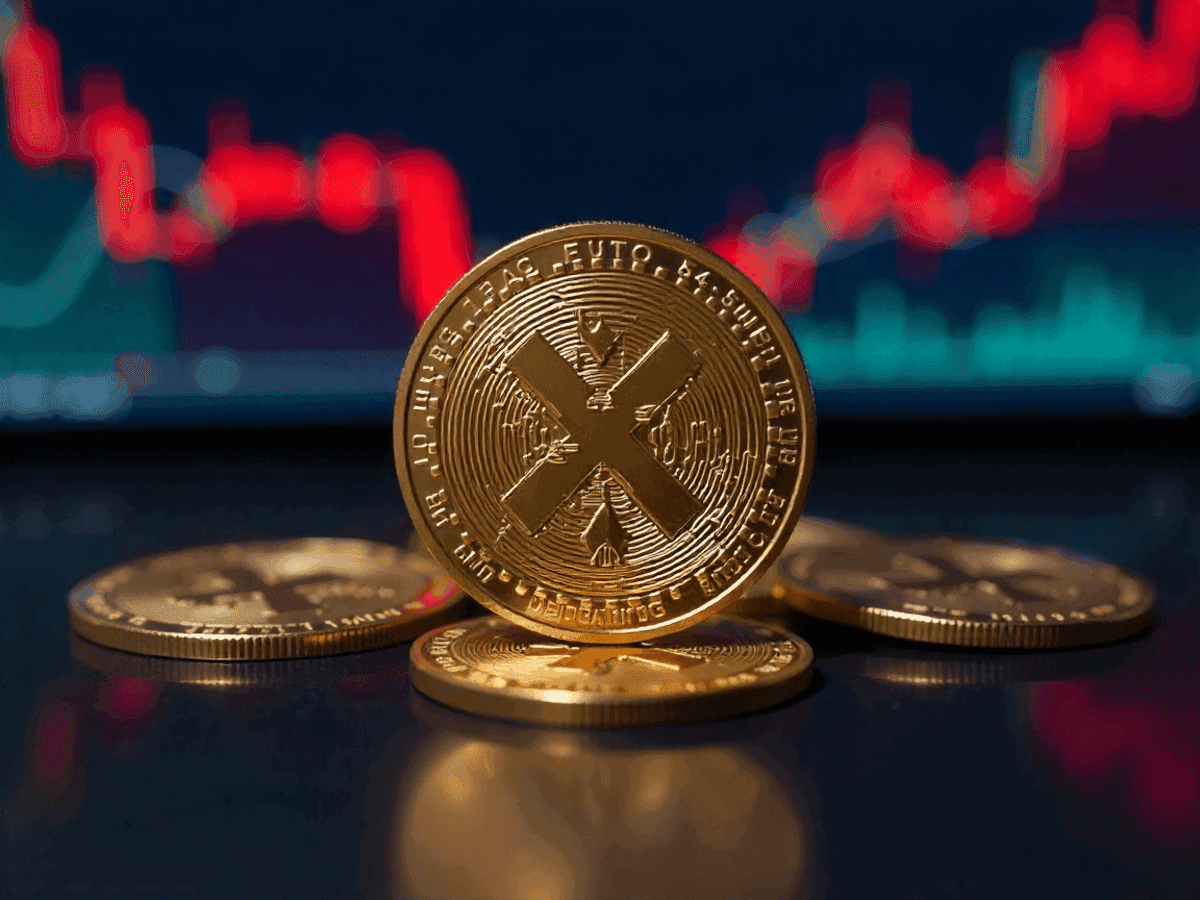
XRP Price Prediction: Why XRP Crashed to $1 as Bitcoin Broke Below $60,000
XRP just crashed toward $1 as Bitcoin smashed below $60K. Here's the chart analysis and the XRP price prediction for where Ripple goes next.

XRP is getting hammered. As Bitcoin smashed below the $60,000 floor, Ripple's token cratered right alongside it, sliding all the way down to around $1.08 after briefly dipping below $1.05. The $1 psychological level — once a distant safety net — is now staring traders dead in the face.
How did XRP crash to $1?
This wasn't an XRP-specific collapse — it was guilt by association. $XRP has a long, well-documented history of amplifying Bitcoin's moves to the downside. On every major Bitcoin drop this year, XRP has lost close to twice as much as Bitcoin, with the ratio staying consistent at around 1.8 to 1.
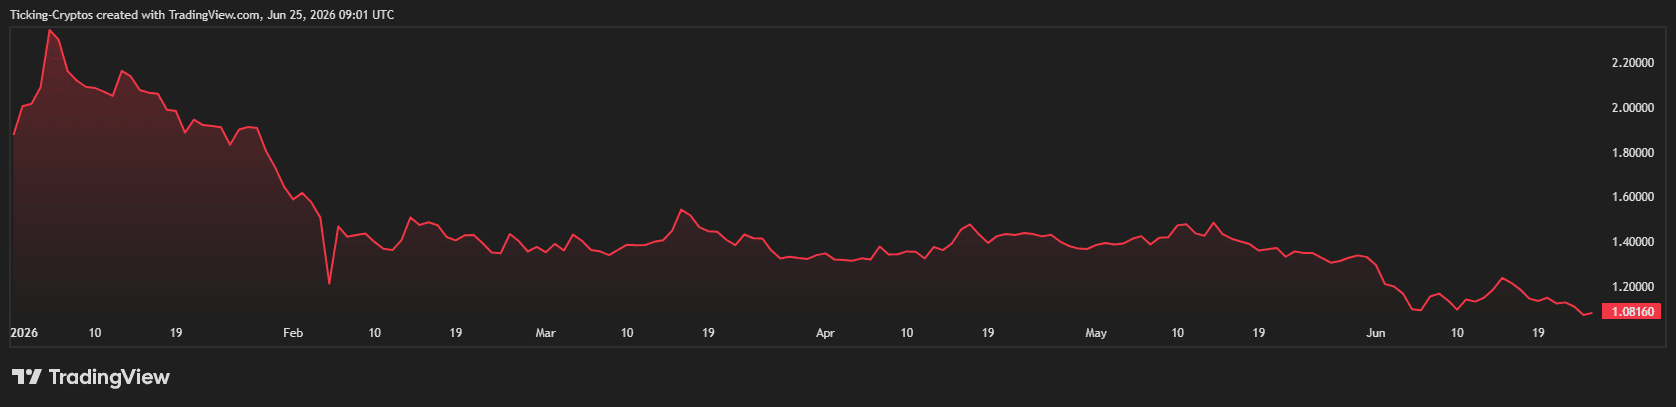
So when Bitcoin broke below $60,000, XRP didn't stand a chance of holding firm. The setup here is arguably uglier than the last big flush. Bitcoin breaking below $60,000 for the first time since October 2024 — after Strategy broke its years-long never-sell rule and spot Bitcoin ETFs ended their longest outflow streak ever — created conditions worse than the February Iran-war crash, when buyers had stepped in at the $1.11 level that has now broken.
And the key support that bulls had been defending all year finally gave way. XRP was holding $1.28 — the level buyers had defended on every dip since February — barely a week ago, before sliding steeply with $1.11 broken and the $1 floor closing in.
XRP Price Analysis: Is XRP RISKY to Buy?
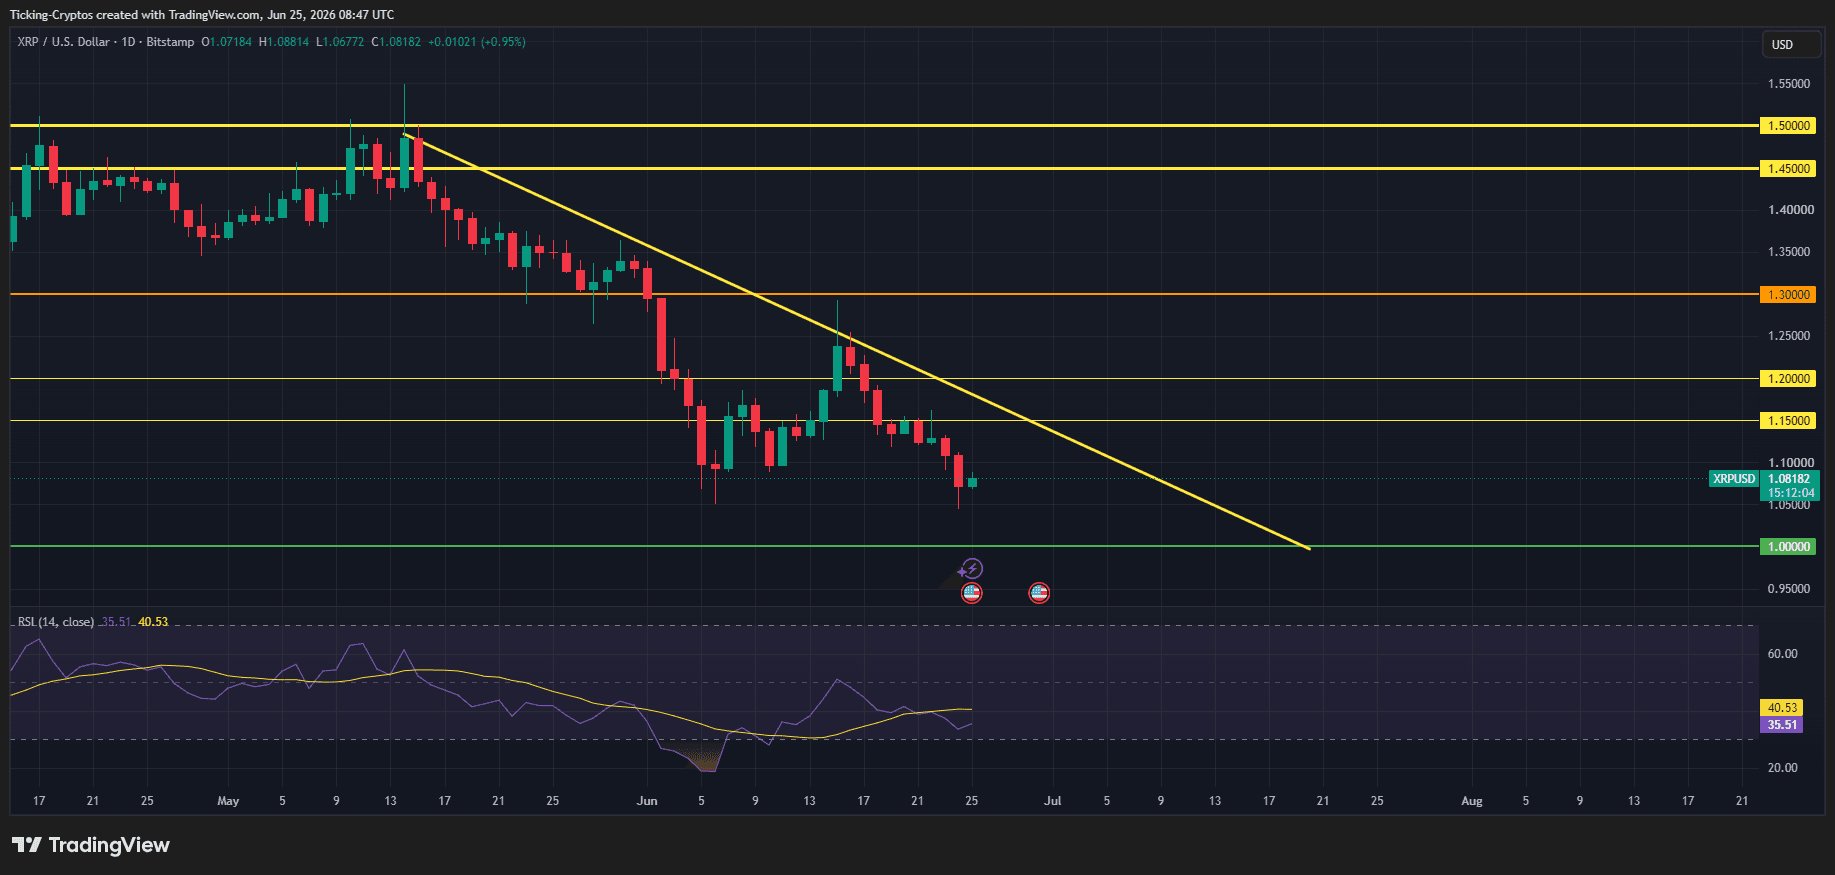
The daily chart paints a textbook bearish picture. Since topping out near the $1.50 resistance zone in mid-May, XRP has been locked inside a clean descending trendline — a steady sequence of lower highs and lower lows that has capped every bounce attempt.
The key technical takeaways:
- The downtrend is intact. Every rally since mid-May has been sold into at the descending yellow trendline. The mid-June bounce toward $1.30 failed exactly there before rolling over again.
- Broken support turned resistance. The $1.15 and $1.20 levels that once acted as support have flipped into overhead resistance. XRP now trades below both.
- The $1.00 line is the last stand. The green support line sits right at the psychological $1.00 mark. That's the level the entire chart is now gravitating toward.
- RSI at 40.53. Momentum is bearish but not yet deeply oversold on the daily. The RSI sitting around 40 means there's still room to fall before sellers are fully exhausted — a warning sign for anyone expecting an immediate bounce.
The structure is clear: until XRP can reclaim the descending trendline and flip $1.15 back to support, the path of least resistance points lower.
XRP price prediction: where does Ripple go next?
Here's where it gets interesting. The near-term picture hinges almost entirely on two things — Bitcoin and the CLARITY Act.
- The bearish case (downside to $1 and below). With $1.05 broken, the chart is thin. Analysts identify $1.13 as XRP's critical weekly support, noting that a confirmed break below it could bring the $0.90–$1 target zone into focus, citing Bitcoin's weakness as the key drag. Worse-case macro scenarios get uglier still — should Bitcoin drop beneath $60,000 while ETF decisions stall and regulatory progress halts, some projections suggest XRP could settle between $0.21 and $0.75. That's a tail risk, not a base case, but it shows how much damage a prolonged BTC breakdown could do.
- The bullish case (a violent snap-back). Here's the twist that makes XRP fascinating right now. While the price bleeds, on-chain data tells the opposite story. XRP whales now control 45.83 billion tokens — 68.5% of circulating supply, the highest concentration since May 2018 — and Binance whale outflow dominance recently hit 91.4%, the same reading that preceded XRP's rally from $0.50 to over $3 in late 2024. On top of that, positioning is extremely lopsided: short bets currently outweigh longs by roughly 9 to 1, meaning any surprise positive catalyst — like a Senate floor vote going through — could trigger a short squeeze that moves XRP far faster than fundamentals alone would suggest.
- The CLARITY Act is the wildcard. This is the single biggest swing factor. If the bill clears and the macro stabilizes, Standard Chartered forecasts XRP could hit $2.80, with the bullish analyst range extending toward $8 — but if the CLARITY Act stalls and slips to 2030 or beyond, prices could drop closer to $0.53. That's roughly 30–40% downside against 2.5x–7x upside, which is exactly why XRP holders are glued to this vote.
The levels that matter
For your XRP price prediction watchlist, keep these on the radar:
- Immediate support: $1.05, then the all-important $1.00 psychological floor.
- If $1 breaks: the $0.90 zone comes into play, with little technical support beneath.
- Upside reclaim: XRP needs to break back above the descending trendline and flip $1.15 into support to even begin repairing the structure. Above that, $1.20 and $1.30 are the next hurdles.
XRP Price Prediction: Will XRP Crash Below 1$?
XRP's crash to $1 isn't a Ripple problem — it's a Bitcoin problem, amplified by XRP's tendency to fall nearly twice as hard on every BTC drop. The daily chart is firmly bearish, the descending trendline is still in control, and the $1.00 line is the last meaningful support before things get really thin.
But the setup is a coiled spring. With whales accumulating, shorts dangerously crowded, and the CLARITY Act floor vote looming as a binary catalyst, XRP could see an explosive move in either direction. For now, respect the downtrend — but don't be surprised if a single headline flips this chart violently.