Top 3 Price Prediction Bitcoin, Ethereum, Ripple: Market crashes as BTC plummets to $34,000
The cryptocurrency market collapsed today losing close to $120 billion in market capitalization in just a few hours after Bitcoin price plummeted from $39,747 down to $34,408. The collapse was somewhat surprising as Joe Biden, the upcoming President of the […]


The cryptocurrency market collapsed today losing close to $120 billion in market capitalization in just a few hours after Bitcoin price plummeted from $39,747 down to $34,408. The collapse was somewhat surprising as Joe Biden, the upcoming President of the United States just announced a $1.8 trillion stimulus.
Biden intends to pay $1,400 to eligible participants in addition to the $600 already approved totaling $2,000 for each one. Even more surprising was the rise of the DXY, the U.S. Dollar Index, which is usually inversely correlated to Bitcoin. DXY surged by 0.51% to 90.699 despite the stimulus package announcement.
Bitcoin Price crashes but defends crucial support level
The cryptocurrency market is extremely volatile right now and it’s important to zoom out to understand where we are. BTC price is currently at $36,000 just above the 12-EMA on the daily chart, an important support level.
BTC/USD daily chart – TradingView
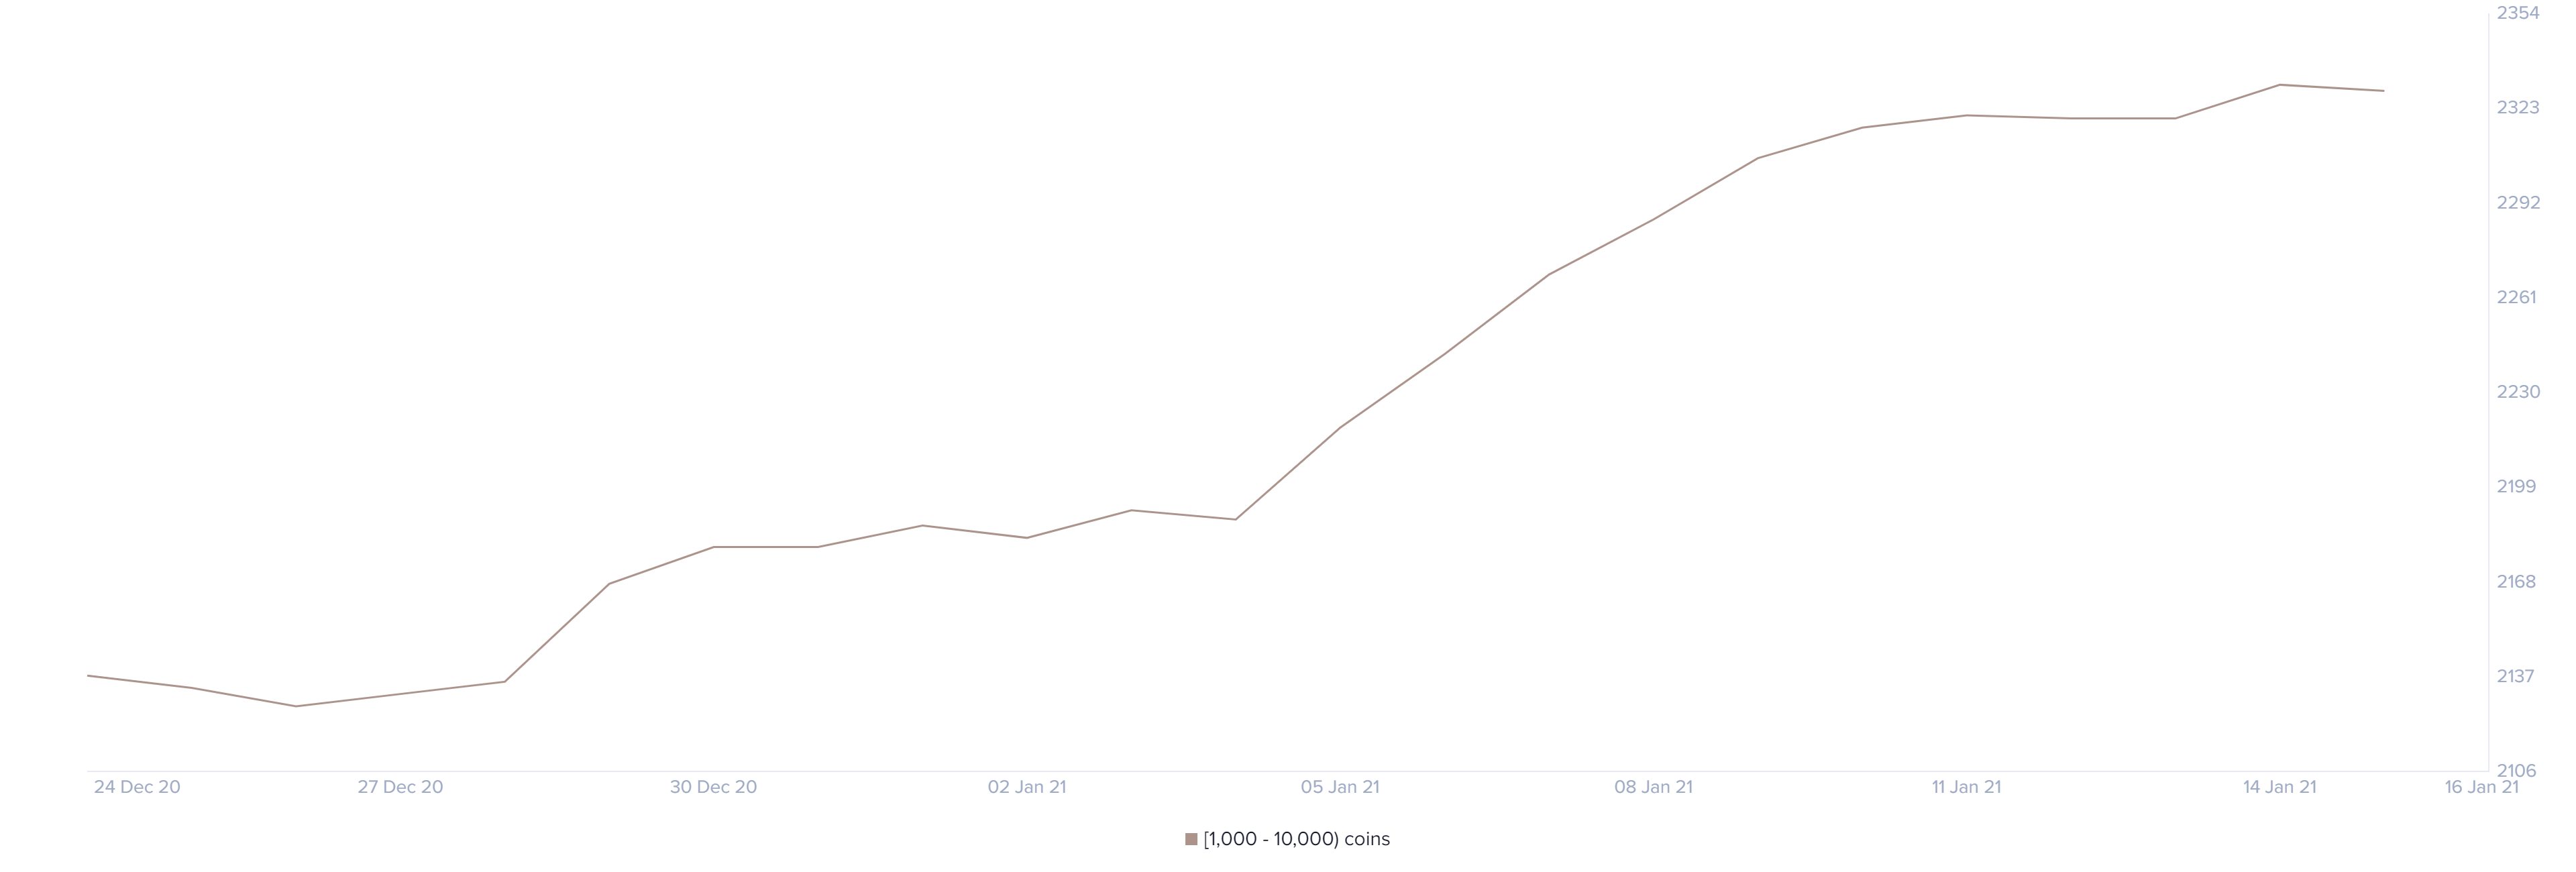
Below, we can find the 26-EMA support level which is the most critical. As long as the bulls can hold this level, the bull rally will remain intact. Additionally, it’s also crucial to understand that whales have been accumulating Bitcoin since December 2020. The biggest jump we have seen is from January 4 to January 14, where the number of whales holding at least 1,000 BTC exploded from 2,189 to 2,331, despite the extreme volatility and high price.
This indicates that whales are ok with buying the digital asset at its current price and the recent sell-off was not large holders taking profit but rather traders panic selling. Furthermore, the number of Bitcoin inside exchanges continues declining, which also indicates most investors are not selling.
Ethereum Price slightly outperforms Bitcoin
In the past 48 hours, ETH price has been outperforming BTC price rising by more than 10% in the ETH/BTC chart. On the 12-hour chart, ETH/BTC has formed a symmetrical triangle pattern which is also part of a bull flag.
ETH/BTC 12-hour chart – TradingView
A breakout above the top trendline at 0.0326 BTC would be a significantly bullish indicator capable of sending Ethereum to a new all-time high, as well as being a good indication of a potential alt season.
XRP Price is stale but holds better than Bitcoin
Amazingly, XRP price is only down 6% in the past 24 hours while BTC is down 8%. The digital asset has been trading sideways for the past week and a half. However, it seems that bulls are able to buy the dips below $0.28 but can’t push XRP price above $0.30
XRP/USD 12-hour chart – TradingView
This can go on for weeks or months until we have a final decision from the SEC as large investors are most likely not interested in joining XRP right now. The Grayscale Trust Fund has just recently announced that it will drop XRP as an investment dissolving the XRP Trust because of the SEC suit.