Top 3 Price Prediction: Bitcoin, Ethereum and Ripple on the verge of a massive breakout
The cryptocurrency market has been trading sideways for the past week losing some of its notorious volatility. The total market capitalization has been ranging from $550 billion to $592 billion as most of the major cryptocurrencies like Bitcoin, Ethereum, and […]


The cryptocurrency market has been trading sideways for the past week losing some of its notorious volatility. The total market capitalization has been ranging from $550 billion to $592 billion as most of the major cryptocurrencies like Bitcoin, Ethereum, and Ripple have been consolidating.
Bitcoin Price Analysis: Investors watch 2 key levels
On the 4-hour chart, Bitcoin price has established a descending triangle pattern which can extend further for the next week. The upper trendline resistance is currently located at $19,320. A breakout above this critical resistance point can quickly drive Bitcoin price towards $20,300 establishing a new all-time high.
BTC/USD 4-hour chart – TradingView
Similarly, a breakout below the lower trendline at $18,600 would push Bitcoin price towards $17,500. The MACD just turned bearish but it’s not very significant. On the other hand, bulls have defended the 12-EMA and the 26-EMA as BTC’s price is currently closer to a breakout than anything else.
Ethereum Price Analysis: ETH aims for a 21% move
Ethereum has established some sort of ascending wedge on the 4-hour chart which is closer to a breakout than Bitcoin. The current price of ETH at $594 is closer to a breakdown below the lower trendline at $590.
ETH/USD 4-hour chart – TradingView
Losing this level would quickly push Ethereum price towards $467. On the other hand, a breakout above the upper boundary of the pattern at $622 would drive Ethereum to a new 2020-high at around $756.
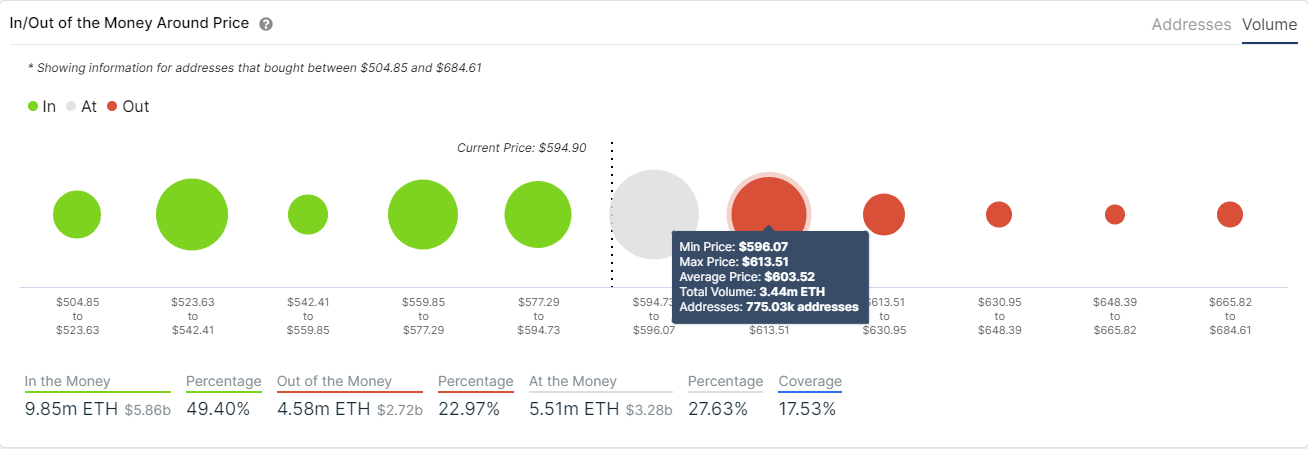
The In/Out of the Money Around Price chart seems to clearly favor the bulls as it shows only one significant resistance area between $596 and $613 but practically no opposition above it. On the way down, there are several support levels that are stronger than the resistance above.
Ripple Price Analysis: XRP suffers a major breakdown but manages to recover
In one of our last technical analysis articles, we discussed the possibility of XRP breaking out of a symmetrical triangle pattern on the 4-hour chart with a bearish price target of $0.4.
Ripple price did slip below the support trendline of the pattern and touched $0.54 but bears didn’t see any type of continuation and bulls quickly regained the 4-hour uptrend, climbing above the 12-EMA and the 26-EMA and eventually turning both into support levels.
XRP/USD 4-hour chart – TradingView
A new symmetrical triangle pattern has been established inside the same time-frame but with different price targets. A breakout above the upper boundary would lead Ripple price towards $0.82 and a breakdown below would push it to $0.37.
Considering that the entire market is bullish, buyers probably have better odds of seeing a breakout this time, especially after the bears got no real continuation after the clear breakdown of the last triangle pattern.
Make sure to join our Trading Group on Telegram for more awesome tips!