Key Indicators For The 2021 Alt Season Start
Ethereum price was close to hitting $1,000 today, which is definitely the first indicator that the alt season might be coming soon. However, we need more than just one random pump on Ethereum, investors want to see a sustained move […]

Ethereum price was close to hitting $1,000 today, which is definitely the first indicator that the alt season might be coming soon. However, we need more than just one random pump on Ethereum, investors want to see a sustained move and Ethereum outperforming Bitcoin first.
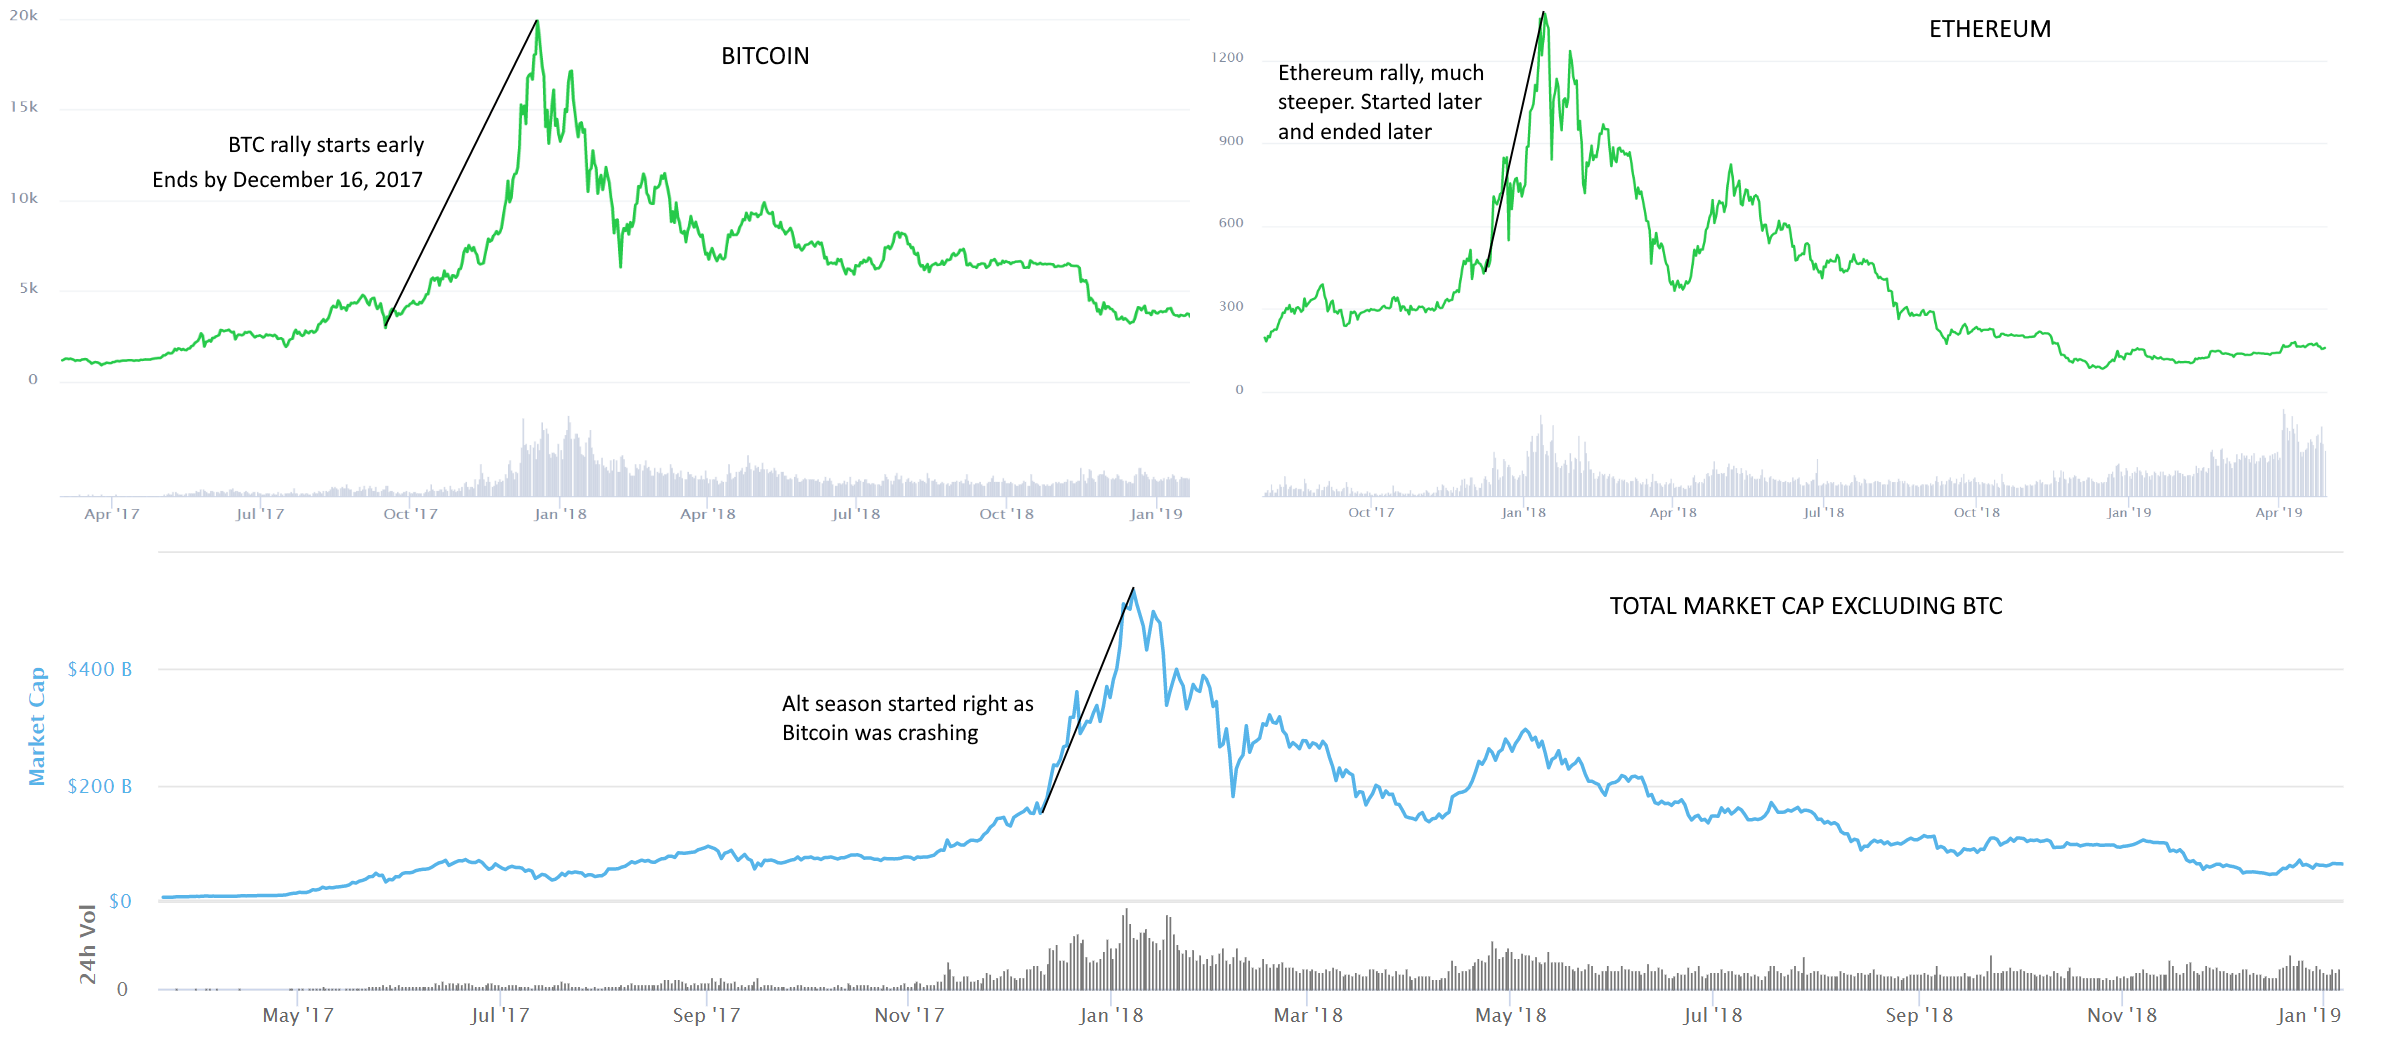
The alt season is characterized by altcoins exploding in price. The last alt season that started around November 2017 was massive. The total market capitalization at the time excluding Bitcoin was around $70 billion and exploded to $542 billion at its peak in January 2018.
It’s important to note that the current total market capitalization excluding Bitcoin is only around $253. In fact, this number doesn’t accurately represent the altcoin market capitalization vs 2017 because we now have thousands of new coins and tokens which inflate that number, especially USDT, USDC, and other stablecoins.
So the truth is that the alt season has definitely not started. But how do we know when it’s close to starting if it does at all? Let’s take a look at some key indicators for an alt season.
Alt season will start when this happens
Let’s take a look at what exactly happened in 2017. First, Bitcoin had a major rally from a low of $3,600 in September to a high of almost $20,000 in December. Ethereum’s price explosion was much steeper and happened around November 19 from $351 to a high of $1,400.

Bitcoin peaked on December 16 and plummeted by the end of 2017. However, the alt season basically started on December 11, just a few days before Bitcoin’s crash, and lasted until January 7, 2018, even though Bitcoin was still crashing. Similarly, Ethereum continued rising until January 13 and was extremely close to surpassing Bitcoin’s total market capitalization.
If past price history repeats, it would mean that we need to see Ethereum’s price explode and then outperform Bitcoin as the flagship cryptocurrency beings to pull back. So far, Ethereum price did have a major run to $970 and has changed the daily trend on the ETH/BTC chart for the first time since November 2020.
ETH/BTC weekly chart – TradingView
However, the most critical resistance point on the ETH/BTC weekly chart is located at 0.035 BTC. If Ethereum bulls can push the digital asset above this point or Bitcoin crashes while ETH maintains its value and it finally cracks this level, we can be certain that Ethereum is outperforming Bitcoin.
This would be the most notable indicator of the alt season start. However, it’s important to note that the environment is far different now and the institutional interest in Bitcoin is extremely high compared to 2017. This could mean that Bitcoin might remain strong while an alt season begins to form.


