Unveiling the Cryptocurrency Matrix: A Comprehensive Guide to The Wyckoff Method
The Wyckoff Method centers on understanding the forces of supply and demand that drive price movements. Let's take a look at this.


Introduction: The Wyckoff Method – The Art of Prediction
The financial markets can be a dizzying whirl of numbers, graphs, and jargon. Yet, for those who know how to interpret them, they are like a matrix revealing insights and opportunities. In the realm of cryptocurrency trading, one such tool of interpretation is the Wyckoff Method.
Pioneered by Richard D. Wyckoff, a prominent early 20th-century trader, this method has withstood the test of time. Its principles continue to provide valuable insights into market trends, even in the context of modern digital currencies. Let’s embark on a journey to understand this time-tested approach and how it could be a game-changer in your cryptocurrency trading strategy.
The Basics of the Wyckoff Method
The Wyckoff Method centers on understanding the forces of supply and demand that drive price movements. By analyzing the interplay of these forces, traders can identify potential future market trends.
There are four fundamental laws in the Wyckoff method:
Wyckoff Price Cycle
The Wyckoff Price Cycle illustrates how markets work. According to Wyckoff, markets move in a continuous cycle of Accumulation (smart money buying), Markup (uptrend), Distribution (smart money selling), and Markdown (downtrend).
The Wyckoff Schematic
Wyckoff proposed specific chart patterns that hint at what stage of the price cycle an asset is in. Here’s a breakdown:
Practical Application of the Wyckoff Method
Let’s use a hypothetical cryptocurrency, CryptocoinX, to understand how the Wyckoff method applies to trading.
Accumulation Stage
Imagine CryptocoinX has seen a significant price drop and has entered a period of limited price fluctuation. As a Wyckoff trader, you identify this as the potential accumulation phase. You spot a selling climax where the price momentarily dips before rebounding. This suggests that there’s strong demand at this price level.
Later, you notice another price dip, the secondary test, that fails to go below the selling climax level. This is a positive sign; the asset is being ‘accumulated’, potentially by large institutional investors. Observing these signals, you decide to buy CryptocoinX, anticipating an upcoming price rise.
Markup Stage
As predicted, the price of CryptocoinX begins to increase. The uptrend is underway. Your decision to buy CryptocoinX in the accumulation stage is paying off.
Distribution Stage
After a considerable uptrend, you notice signs of potential distribution. There’s a sudden surge in volume, accompanied by a sharp price increase, potentially the buying climax. This is followed by a price pullback, the automatic reaction, and then a secondary test that attempts to surpass the buying climax but fails. Recognizing these signs, you decide to sell your CryptocoinX holdings, locking in your profits.
Markdown Stage
Following your sale, CryptocoinX enters a downtrend, confirming your suspicion that it was indeed the distribution phase. Your Wyckoff-based analysis helped you avoid this price drop.
The Wyckoff Method in Action: Cryptocurrency Case Studies
To see how the Wyckoff Method works in real-world situations, let’s explore a few examples from the realm of cryptocurrency trading.
Bitcoin’s Accumulation Phase of 2015-2016
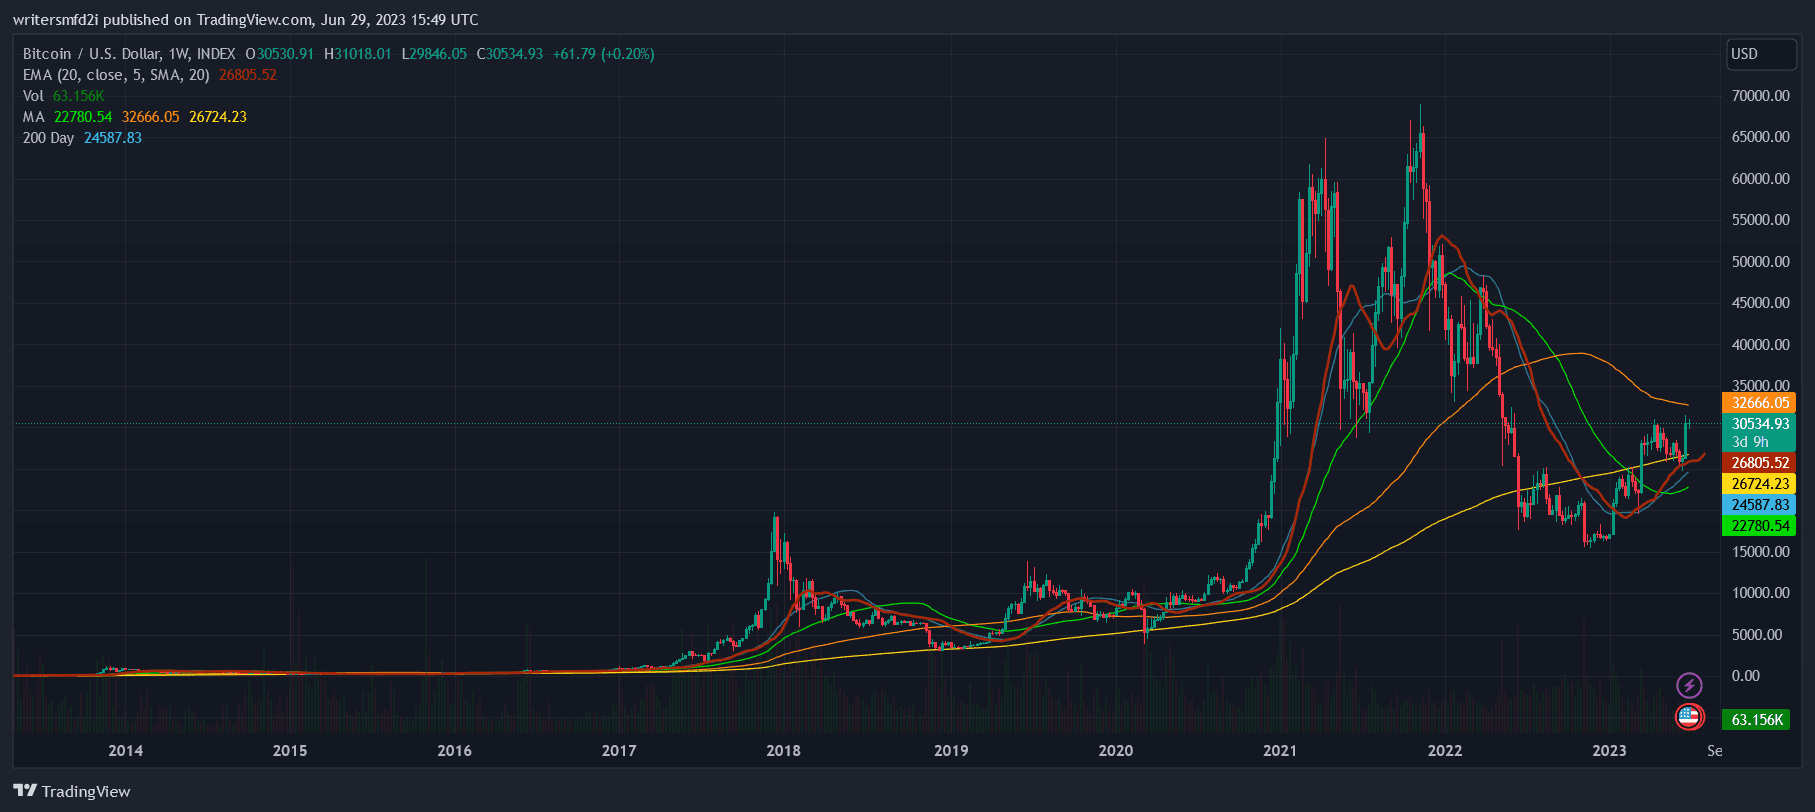
In 2015, following a significant decline from its previous all-time high, Bitcoin entered what we can now identify as the accumulation phase. The price was largely range-bound, oscillating between $200 and $300 over several months. This period was marked by a selling climax in January 2015, with a rapid price drop and subsequent recovery.
A secondary test occurred in August 2015, reaching similar lows but failing to push the price significantly lower. This was a clear sign that demand was absorbing the selling pressure. Eventually, after a series of smaller tests and a successful spring, Bitcoin’s price embarked on an upward journey in late 2016, marking the end of the accumulation phase and the beginning of the markup phase.
Ethereum’s Distribution Phase of 2017-2018
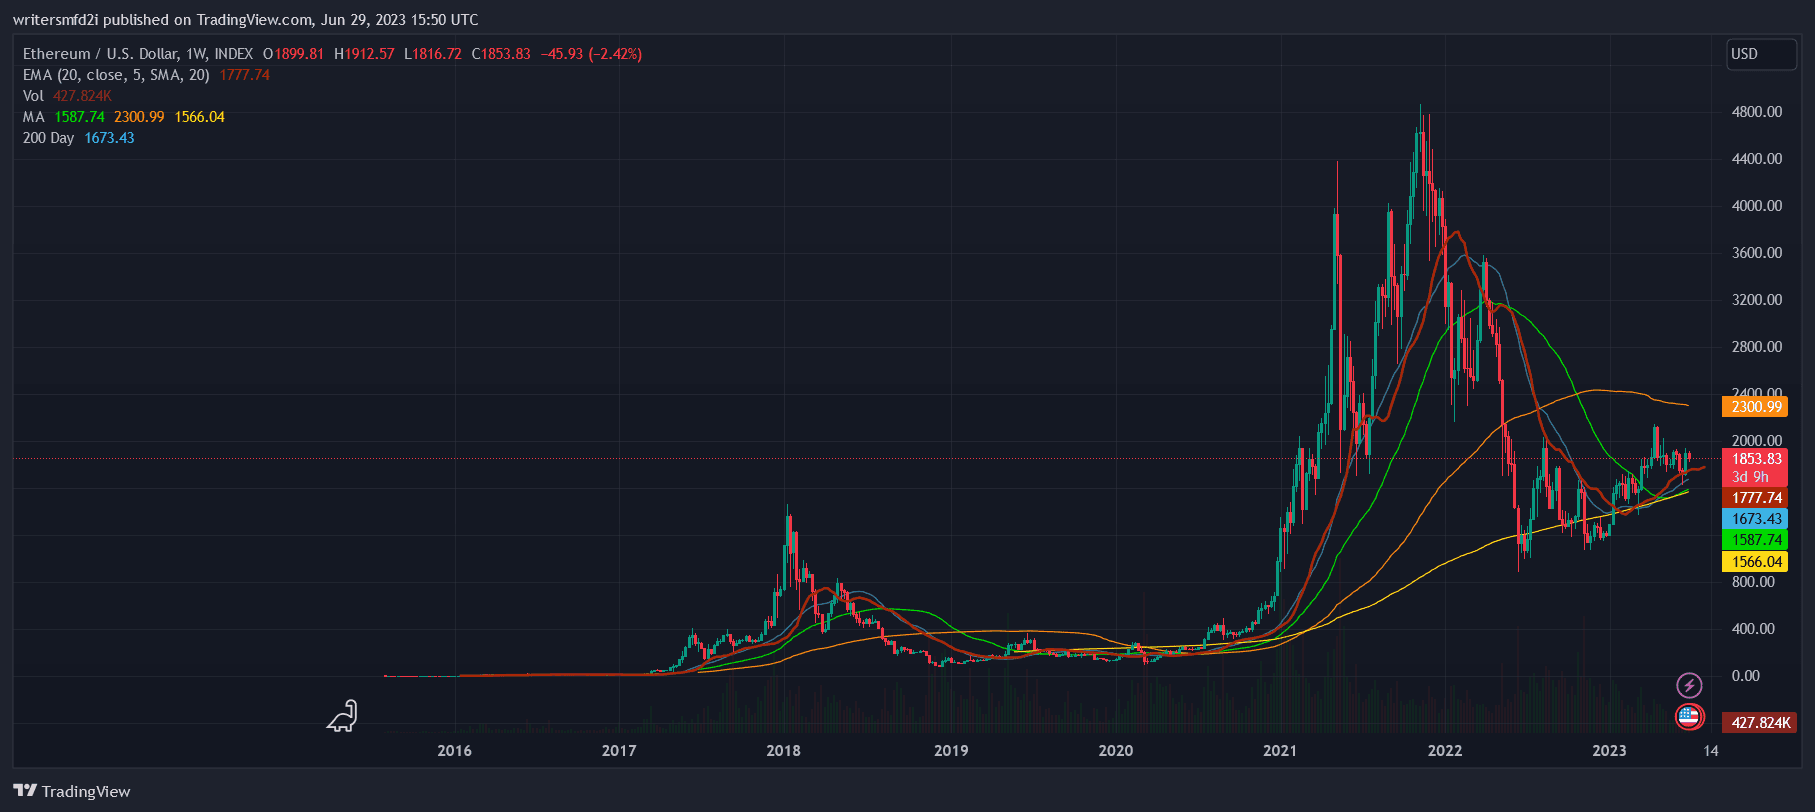
Fast-forward to Ethereum at the end of 2017. After an extraordinary bull run, Ethereum reached a peak of around $1,400 in January 2018. This peak was accompanied by extreme trading volume, potentially marking the buying climax.
After this, the price retraced significantly before rebounding to a lower high in May 2018. This could be considered the secondary test. However, unlike in the accumulation phase, this test failed to exceed the buying climax price, a sign of weakening demand.
An upthrust was attempted in July 2018, but the price was pushed back down, displaying a sign of weakness. Over the following months, Ethereum’s price fell dramatically, initiating the markdown phase.
Both these examples illustrate how traders equipped with the Wyckoff Method could have potentially interpreted these situations to their advantage. In Bitcoin’s case, identifying the accumulation phase could have presented a buying opportunity. On the other hand, recognizing Ethereum’s distribution phase might have warned of an upcoming bear market.
However, it’s crucial to remember that while the Wyckoff Method can provide valuable insights, it should be used in conjunction with other analysis tools for the most reliable results. Furthermore, past performance is not a guarantee of future results, and all trading decisions should be made based on thorough analysis and personal risk tolerance.
Conclusion: The Power of Wyckoff
The Wyckoff Method, like any other trading strategy, is not a surefire way to profit. It’s a method based on observation, interpretation, and probability. However, understanding its principles can certainly enhance your market analysis skills, helping you make more informed trading decisions.
Cryptocurrency trading can be a wild roller coaster. But with tools like the Wyckoff Method, you can begin to understand the mechanics behind the ride. That knowledge can turn the bewildering twists and turns of the market into a source of opportunity.