Bitcoin Price Hits $100,000 … Briefly
Bitcoin price experienced a massive spike towards $100,000 on its Quarterly Futures chart. According to the official Binance announcement, a single user placed several large orders over a very short period of time creating an insane candlestick wick up to […]


Bitcoin price experienced a massive spike towards $100,000 on its Quarterly Futures chart. According to the official Binance announcement, a single user placed several large orders over a very short period of time creating an insane candlestick wick up to $99,964.
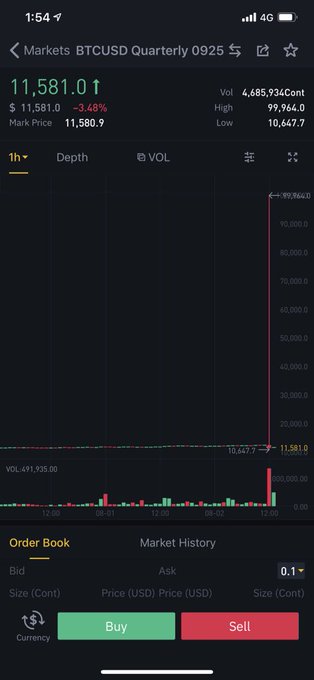
Based on community feedback and also consideration of future user trading experience, Binance will make an adjustment to the K-line of the BTCUSD 0925 Quarterly Futures contract at 2020/08/02 12:00 PM (UTC).
Bitcoin price is currently trading at $11,103 but this incident did cause the entire market to shake. According to Binance, because Futures uses the mark price for liquidations and other calculations, no one was actually liquidated when Bitcoin touched $99,964, however, on the spot market, there was a large fluctuation in price.
BTC/USDT 1h – Tradingview
In less than 1 hour, Bitcoin went from a high of $12,123 to $10,518 before quickly recovering above $11,000. Ethereum price also got affected dropping from $415 to $325 in the same time frame. Other major coins suffered the same price action.
What’s Next For Bitcoin In The Short-Term?
Ignoring the insane price action for BTC that we saw a few hours ago, where is the major digital asset headed to next? The daily chart remains bullish even after the rejection and bulls were able to use the 12-EMA to bounce back up. The daily uptrend will basically remain intact unless the bears can drop BTC price below $9,440.
BTC/USDT 1D – Tradingview
This rejection doesn’t have a lot of trading volume behind it which indicates that bears are not strong but rather bots got triggered to sell, especially after the ridiculous spike to $100,000 on Binance’s quarterly Futures.
The RSI has now cooled off significantly and bulls wouldn’t mind seeing further consolidation while defending the daily 12-EMA before the next leg up.
Bitcoin Price Forecast Long-Term: Bullish
We can easily observe that Bitcoin is heavily bullish on the weekly chart as it is in a strong uptrend and way above both EMAs which are crossed bullishly. BTC is also seeing a significant increase in trading volume and the RSI is not yet overextended.
BTC/USDT 1M – Tradingview
The monthly chart is also bullish for the Bitcoin price as the buyers have been able to keep BTC above both EMAs and have created a higher low at $3,782 compared to $3,156, the low of December 2018.
The high is $13,970 which means that the monthly chart is currently inside an equilibrium pattern unless the bulls can crack this resistance level.
There are two main possibilities for the bulls right now, create a monthly bull flag with continuation above $14,000 or directly crack this level without any kind of consolidation period. Ideally, we would want to see a healthy consolidation first to create enough support levels before the breakout above $14,000.
There is basically no resistance after $14K which means Bitcoin price can easily reach $20,000 again and perhaps hit a new all-time high. For now, bulls are happy with the price action we are seeing.