Bitcoin Extremely Low Volatility Indicates a Big Move is Coming to $10,000 or $8,000
Everyone knows Bitcoin has been extremely flat for the past few months trading between $9,000 and $10,000. Bulls have attempted to break $10K several times but have failed every single attempt getting rejected heavily. A similar trend is also present […]


Everyone knows Bitcoin has been extremely flat for the past few months trading between $9,000 and $10,000. Bulls have attempted to break $10K several times but have failed every single attempt getting rejected heavily.
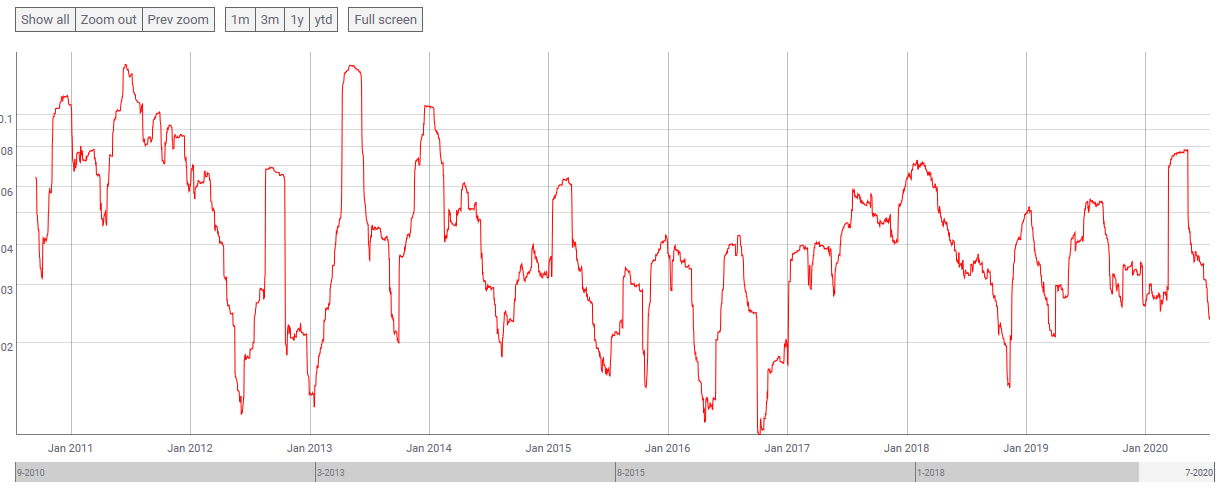
A similar trend is also present on the way down as bulls are constantly defending $9,000. According to Coinmetrics, the current 60d volatility is as low as it was on February 2019.
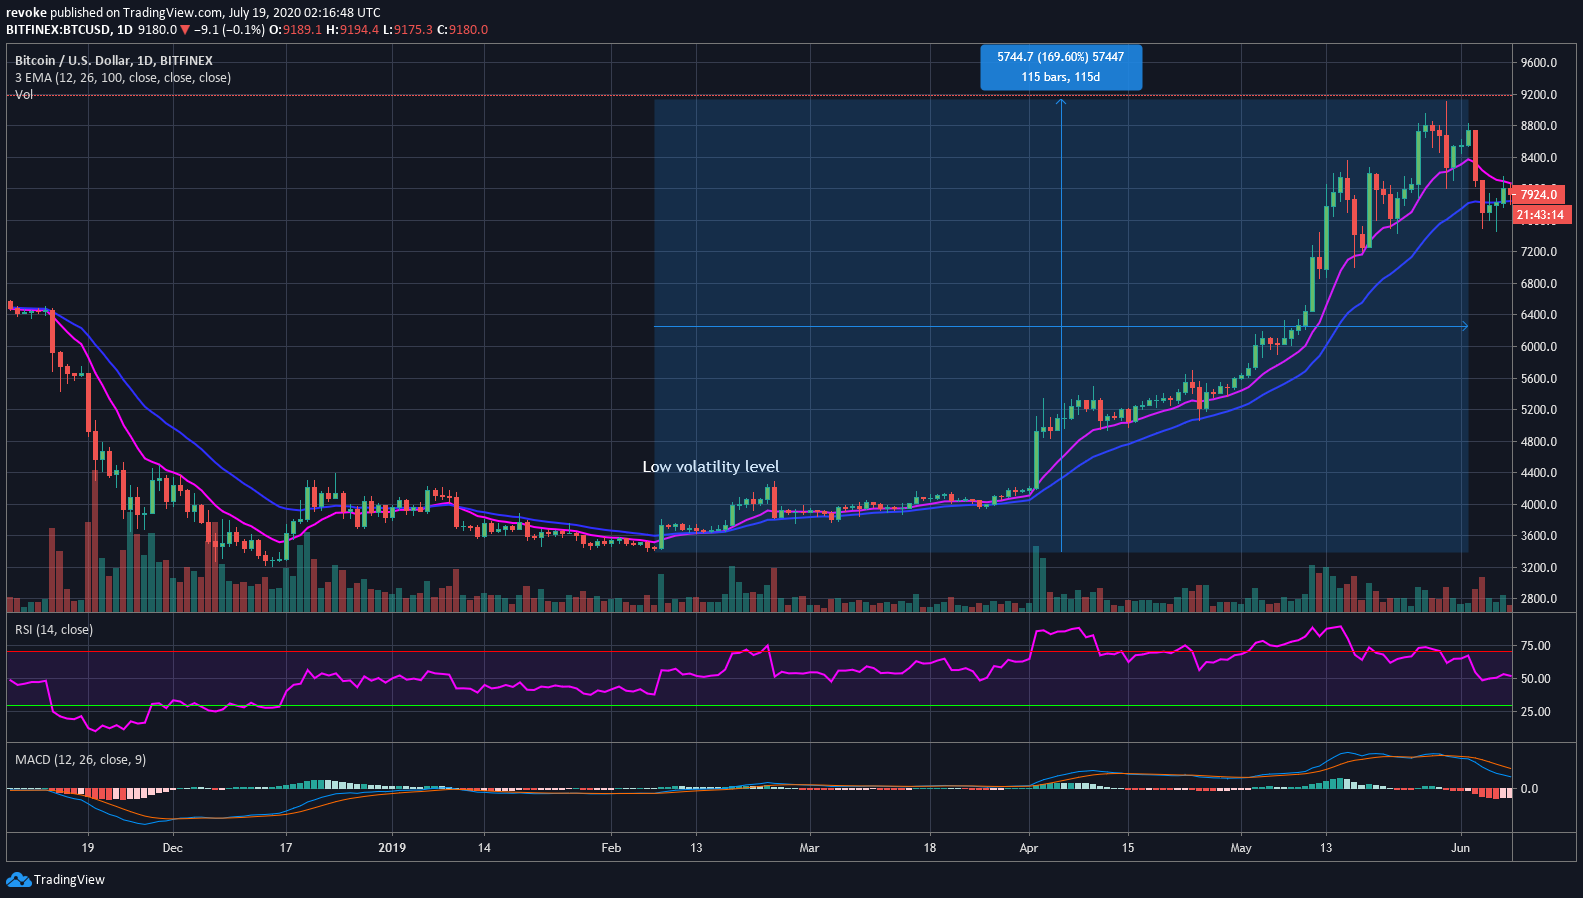
If we take a look at the daily chart on February 2019, we can see Bitcoin trading sideways before a massive 169% bull run to $9,200.
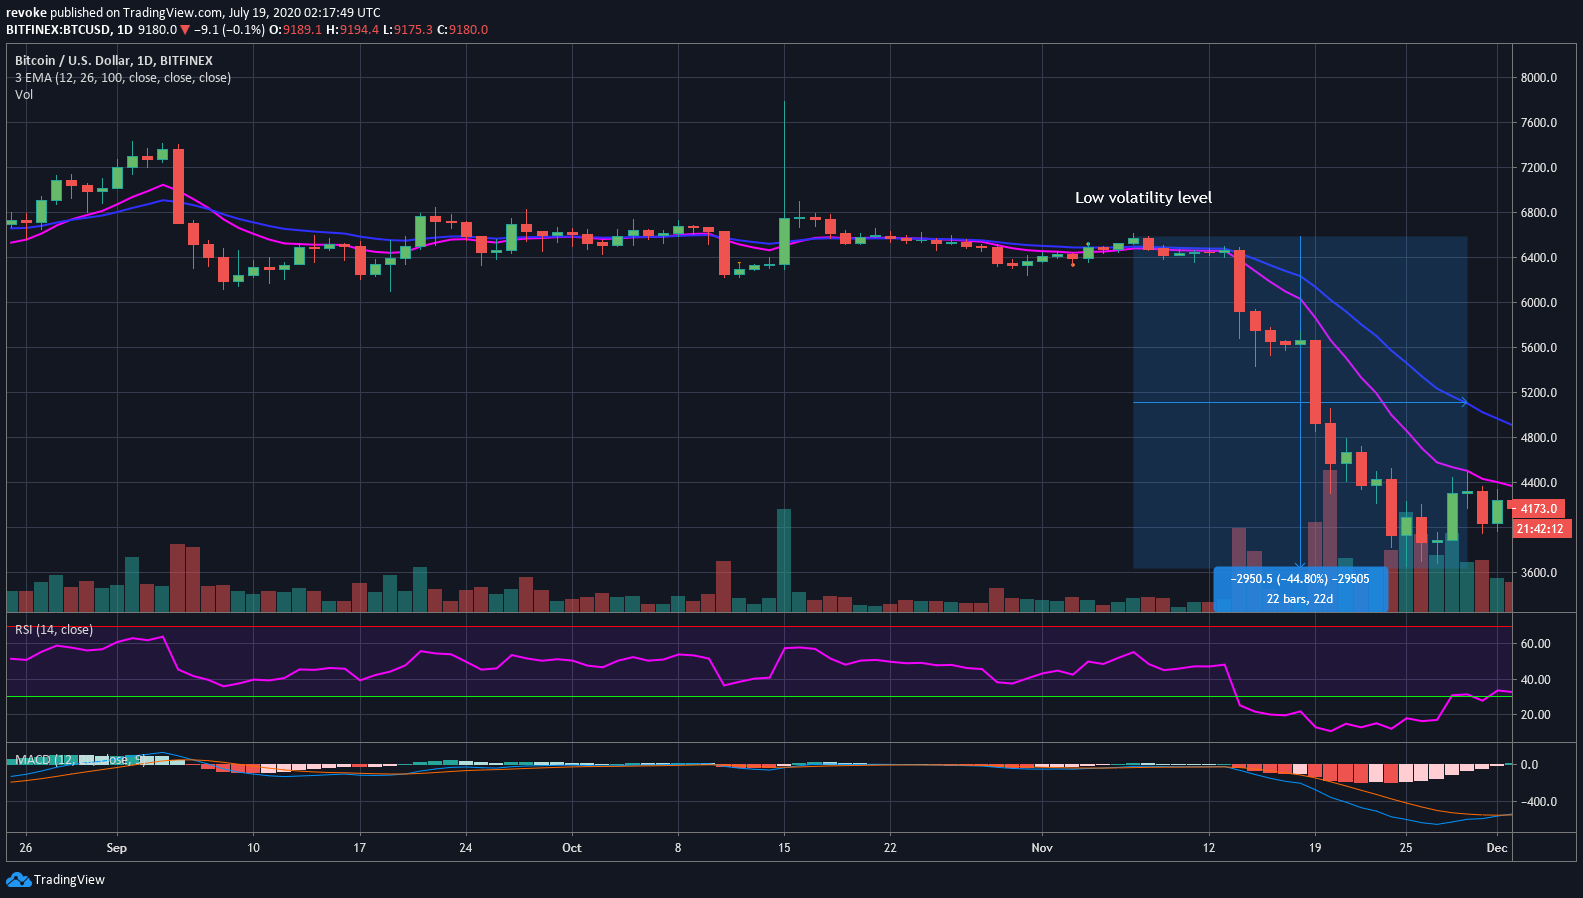
A similar pattern can be observed after Bitcoin’s volatility dropped to an extreme low on November 2018. Bitcoin was trading between $6,300 and $6,500 for weeks before a massive sell-off losing around 45% of its value in the next 20 days.
Clearly, Bitcoin’s volatility has dropped significantly again and we are expecting a big move soon but in which direction?
Where is Bitcoin more likely to move next?
There are obviously two main levels to watch for, $10,000 and $8,000. Both represent crucial resistance and support levels. While Bitcoin’s drops in volatility indicate big moves, they do not indicate the direction.
Bitcoin has been bullish since its drop on March 12 after the COVID-19 was declared as a pandemic, however, for the past two months, Bitcoin has been extremely flat losing a lot of its dominance while altcoins have been soaring.
The main factor affecting Bitcoin right now is, again, the Coronavirus. Plenty of countries have lifted their travel bans and quarantines, however, the virus seems to be coming back and infecting a lot of people again. The fear of another lockdown is keeping Bitcoin and many of the strong indices in the stock market flat.
For the most part, Bitcoin has been following the steps of the SP 500 and others.
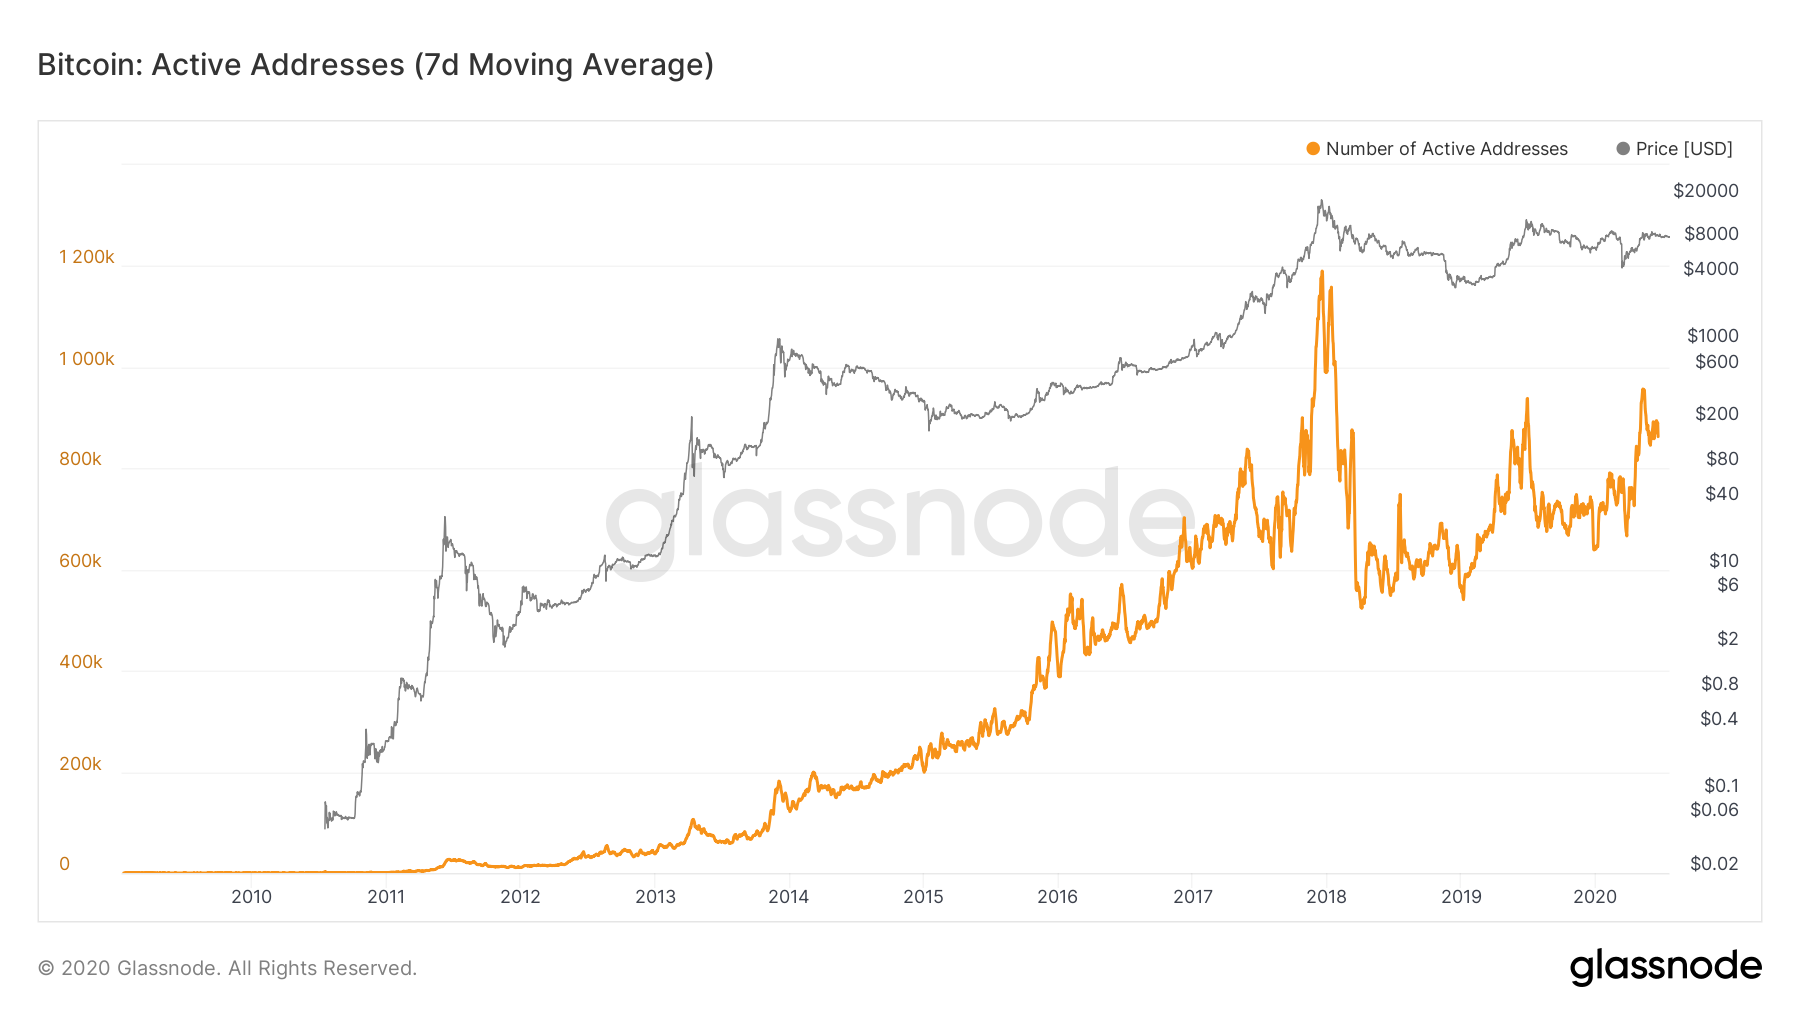
There are numerous long-term positive metrics for Bitcoin starting with the significant increase in active addresses over the past few months. This is notable because Bitcoin hasn’t been doing much which means a lot of people are interested in it even though it is not as volatile as it used to be.
Additionally, the daily futures open interest has been growing a lot since March 17, practically doubling in volume. Now in terms of Technical Analysis, Bitcoin is also doing fairly well in the long-term.
The weekly chart, for instance, is positive and still in favor of the bulls which are defending the 12-EMA which currently stands at $8,976. For the most part, the weekly chart could be considered a bull flag with a bullish MACD.
Similarly, the monthly chart is also fairly bullish with buyers keeping the price way above the 12-EMA at $8,451 and again a positive MACD. The trading volume is obviously dropping, again, indicating a big move is coming.
Considering all these metrics, we can say that Bitcoin is a bit more likely to see a bullish breakout. Unfortunately, if the pandemic forces countries to enter a lockdown again and close borders, Bitcoin is very likely going to suffer even if it’s during a bull breakout.