Is Bitcoin Entering A Bear Market?
The Bitcoin price reached our $11,200 target, then started a correction that could end in a bear market! Where will Bitcoin’s price crash end? Follow us on Twitter! In our last Bitcoin price forecast on the 9th of September, at […]


The Bitcoin price reached our $11,200 target, then started a correction that could end in a bear market! Where will Bitcoin’s price crash end?
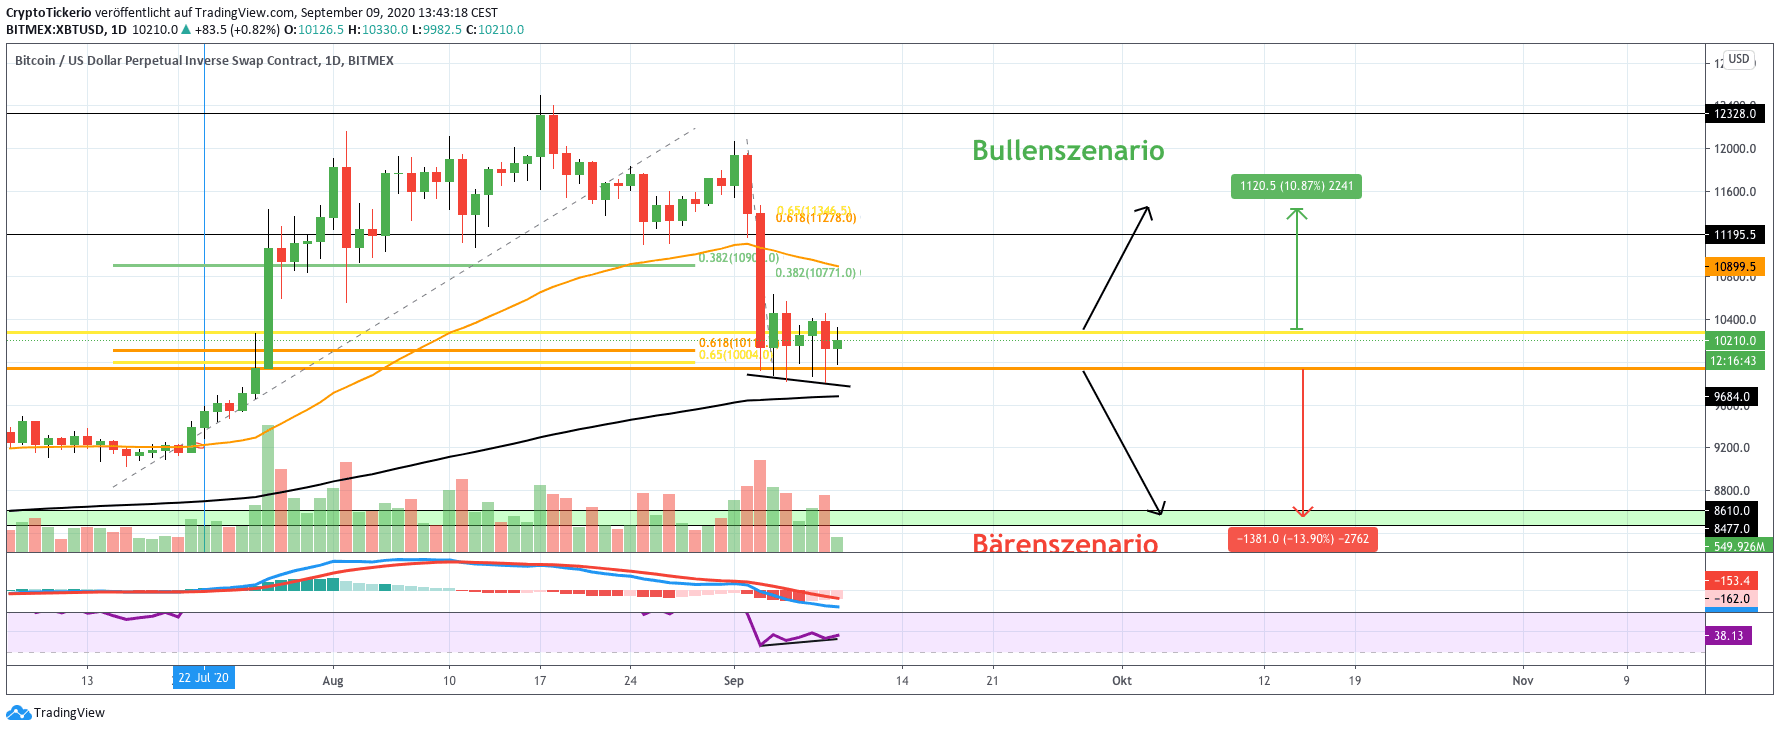
„Even though it came to a death cross in the 4H chart, confirming the trend to be bearish in the middle-term, a bullish divergence has manifested in the RSI, following which the Bitcoin price might now rise to the golden ratio at ±$11,200! This implies an upward potential of around 11%. Should the Bitcoin price not only reach this level, but break it as well, it would be possible for Bitcoin to rise all the way to it recent high of $12,500! “
Bitcoin Price Forecast – Bitcoin’s last chance to remain bullish…
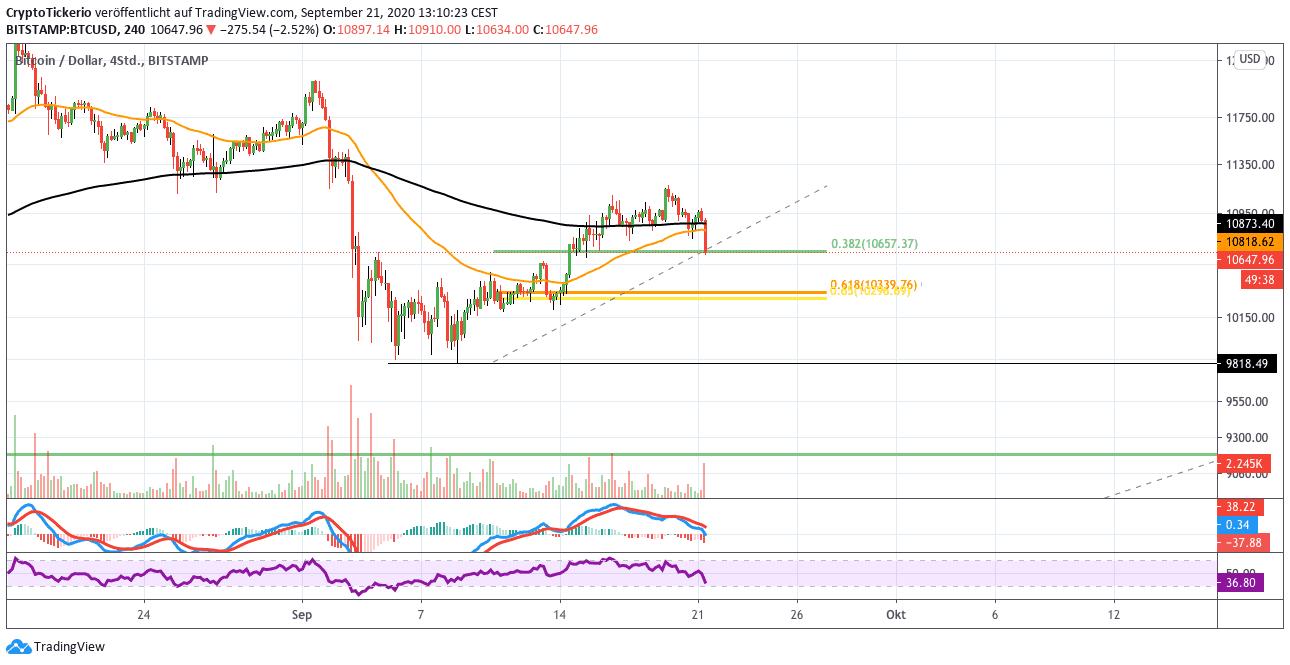
At the time of writing, the Bitcoin price chart lies exactly at the 0.382 Fib level at ±$10,650, and as far as Bitcoin can close the current day above this level, the bullish trend would still be intact for the short and middle term. But should the Bitcoin price fall under this level, we could be seeing a fall back to the ±$10,000 mark!
Bitcoin Price Forecast – Short term goal of ±$11,200 reached!
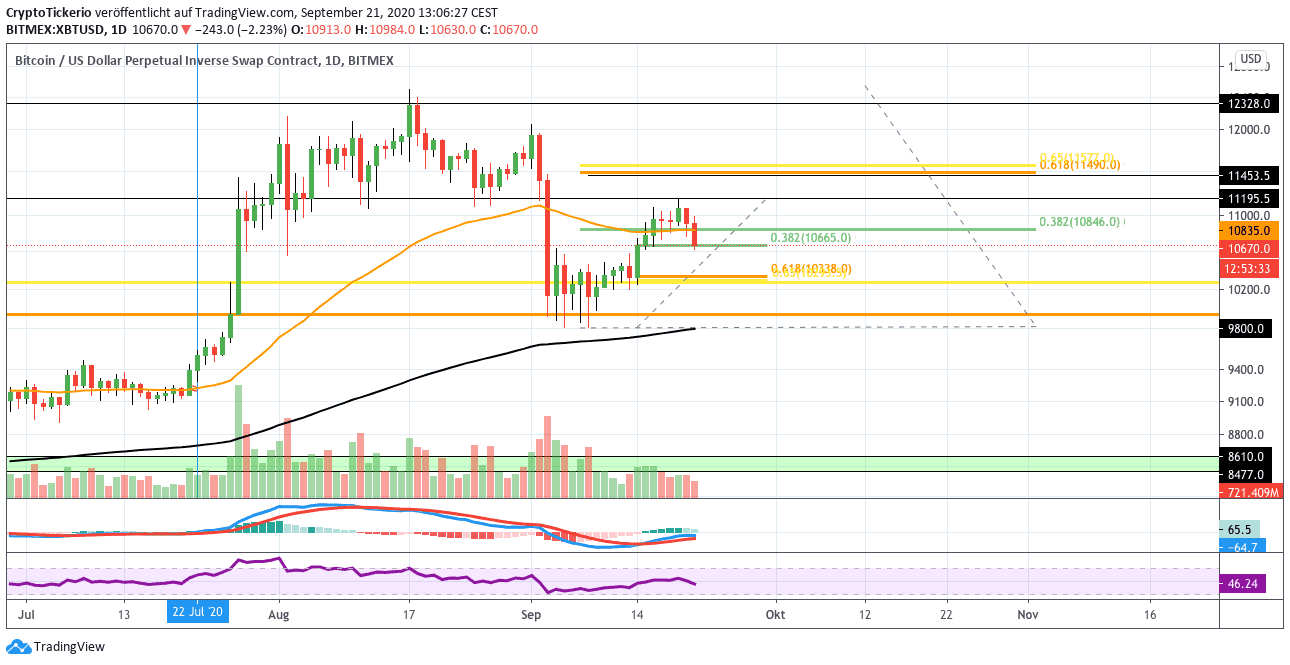
Bitcoin’s price reached our bullish target of ±$11,200 about three days ago, but was met with bearish rejection. Should the Bitcoin price fall through the 0.382 Fib support level at $10,650, then its last chance to avoid a fall down to the $8,600 support is if it undergoes a strong bounce upward off the $10,000 level or at the 200-Daily-EMA support at $9,800 support level.
But should the Bitcoin price fall under $9,800, it could return all the way to the horizontal support at $8,600.
But the MACD also hints at a continuation of the correction. Therefore it remains a possibility that today’s candle closes below the 0.382 Fib support at $10,650.
Bitcoin Price Forecast – Bearish crossover in the weekly MACD!
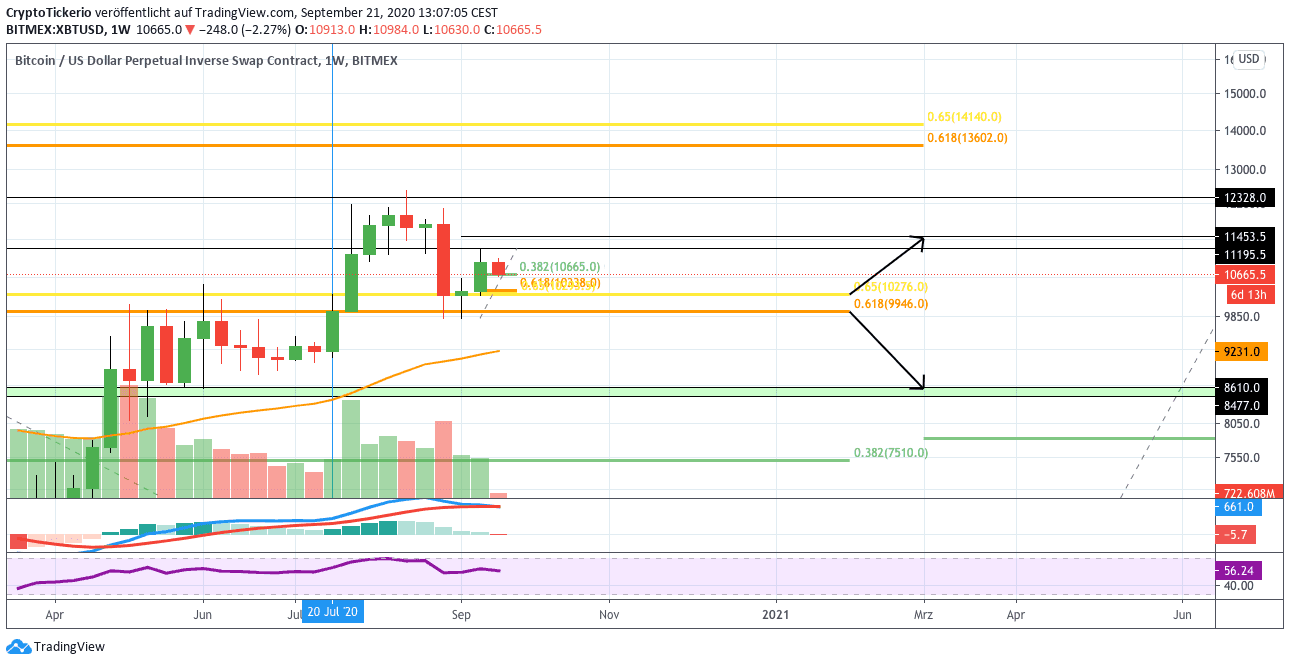
In the weekly chart, the MACD lines look to be having a bearish crossover, while the histogram is bearishly dropping lower too. It remains to be seen if Bitcoin can hold the support at $10,000 or $9,8000 respectively. In case Bitcoin bounces off and continues its upward trend, significant resistances would await it at $11,200 and $12,500.
Bitcoin Price Forecast – Bearish price targets!
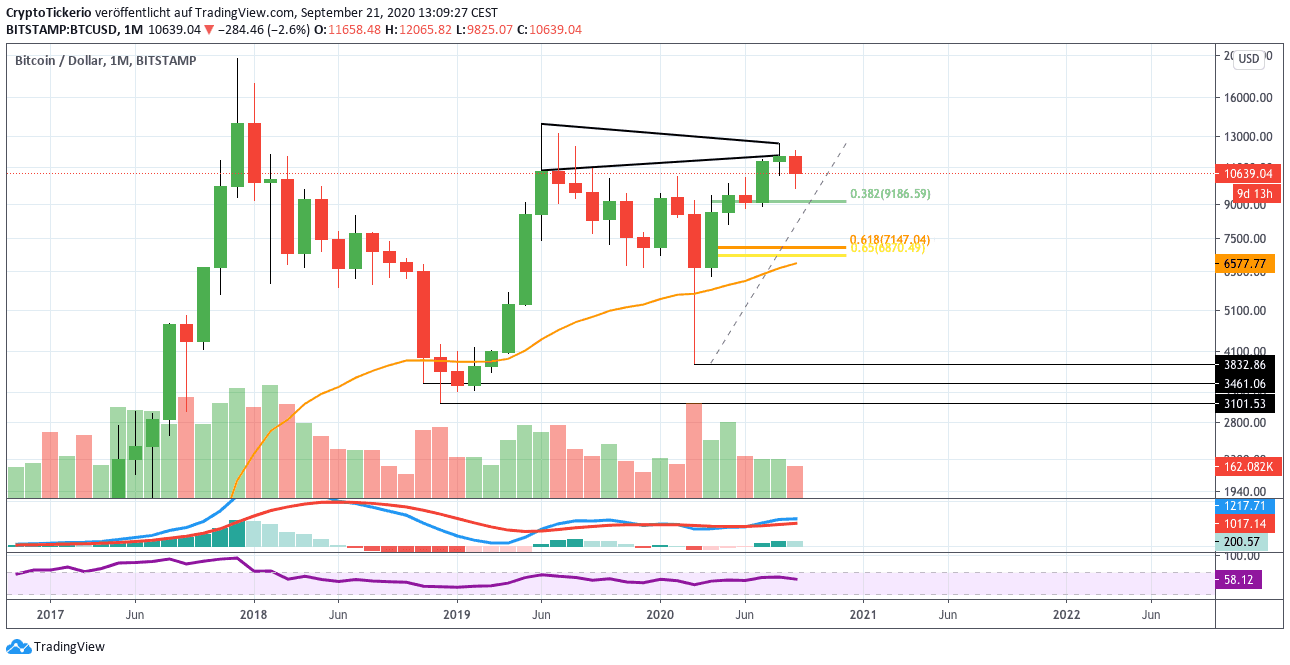
The Bitcoin price did form a higher high when looking at the monthly close, but a lower high when looking at the candles’ wicks. For this reason, the monthly chart doesn’t show a clear direction. The MACD’s histogram is ticking lower, which is a bearish signal, however one more week remains until the monthly candle closes, leaving time for the histogram to change.
Additionally, important support levels for Bitcoin lie at ±$9,200 and ±$6,550 – $7,150. As long as Bitcoin, at the very latest, bounces off the golden ratio at ±$6,800, it would still have a chance to reach $13,800 this year. But with regards to the bearish rejection at the $11,200 mark, it looks more likely that Bitcoin will switch to a bearish trend.
In summary, it could be said that if Bitcoin were to fall beneath $9,800, it wouldn’t be looking too good for the Bitcoin price. It could indicate a bearish trend reversal, and Bitcoin’s bull rally could have reached its end!
Best Regards and successful trades
Konstantin