Polkadot has been one of the hottest cryptocurrencies in the past week, gaining more than 60% in value and reaching a total market capitalization of $7.4 billion for the first time ever. DOT price is currently $8.17 after a 15% price increase in the past 24 hours.
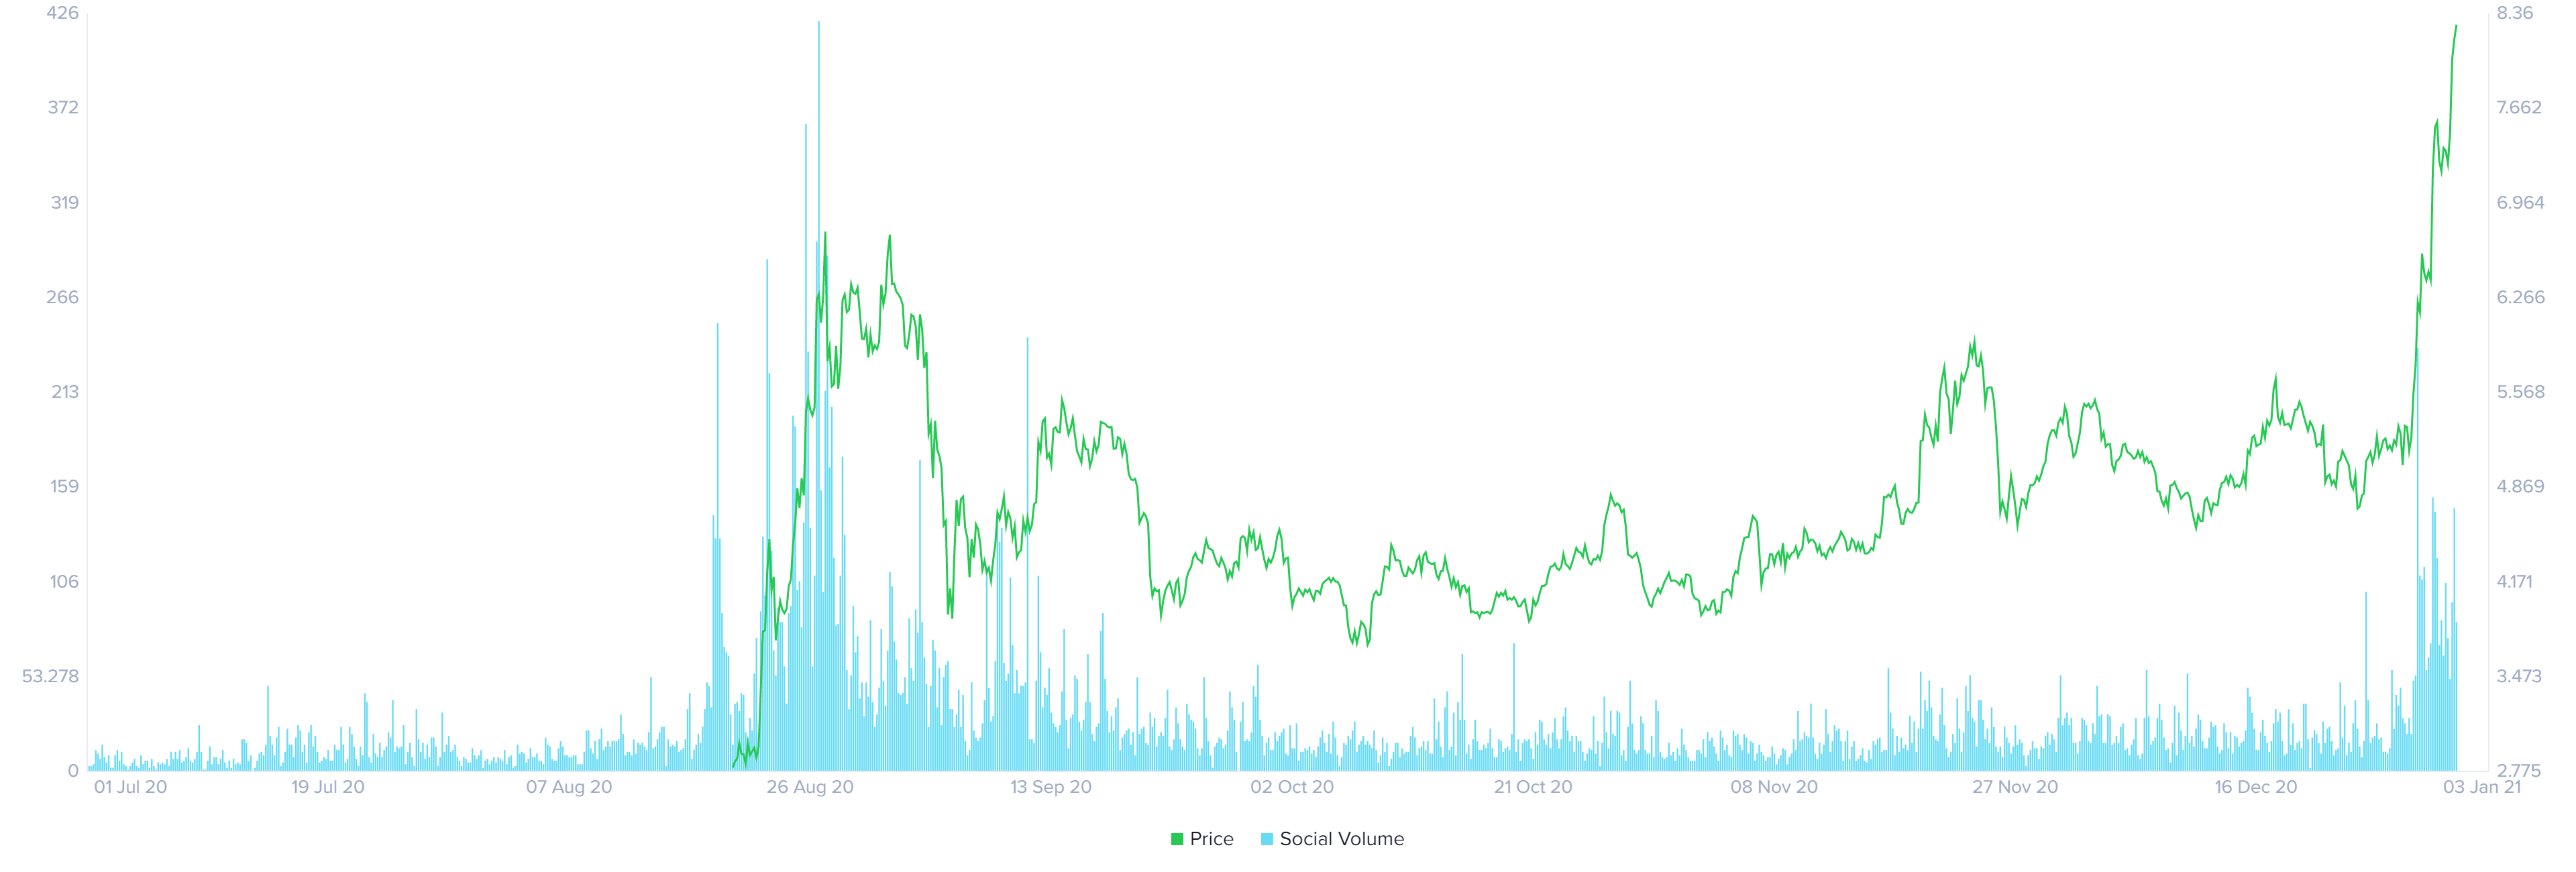
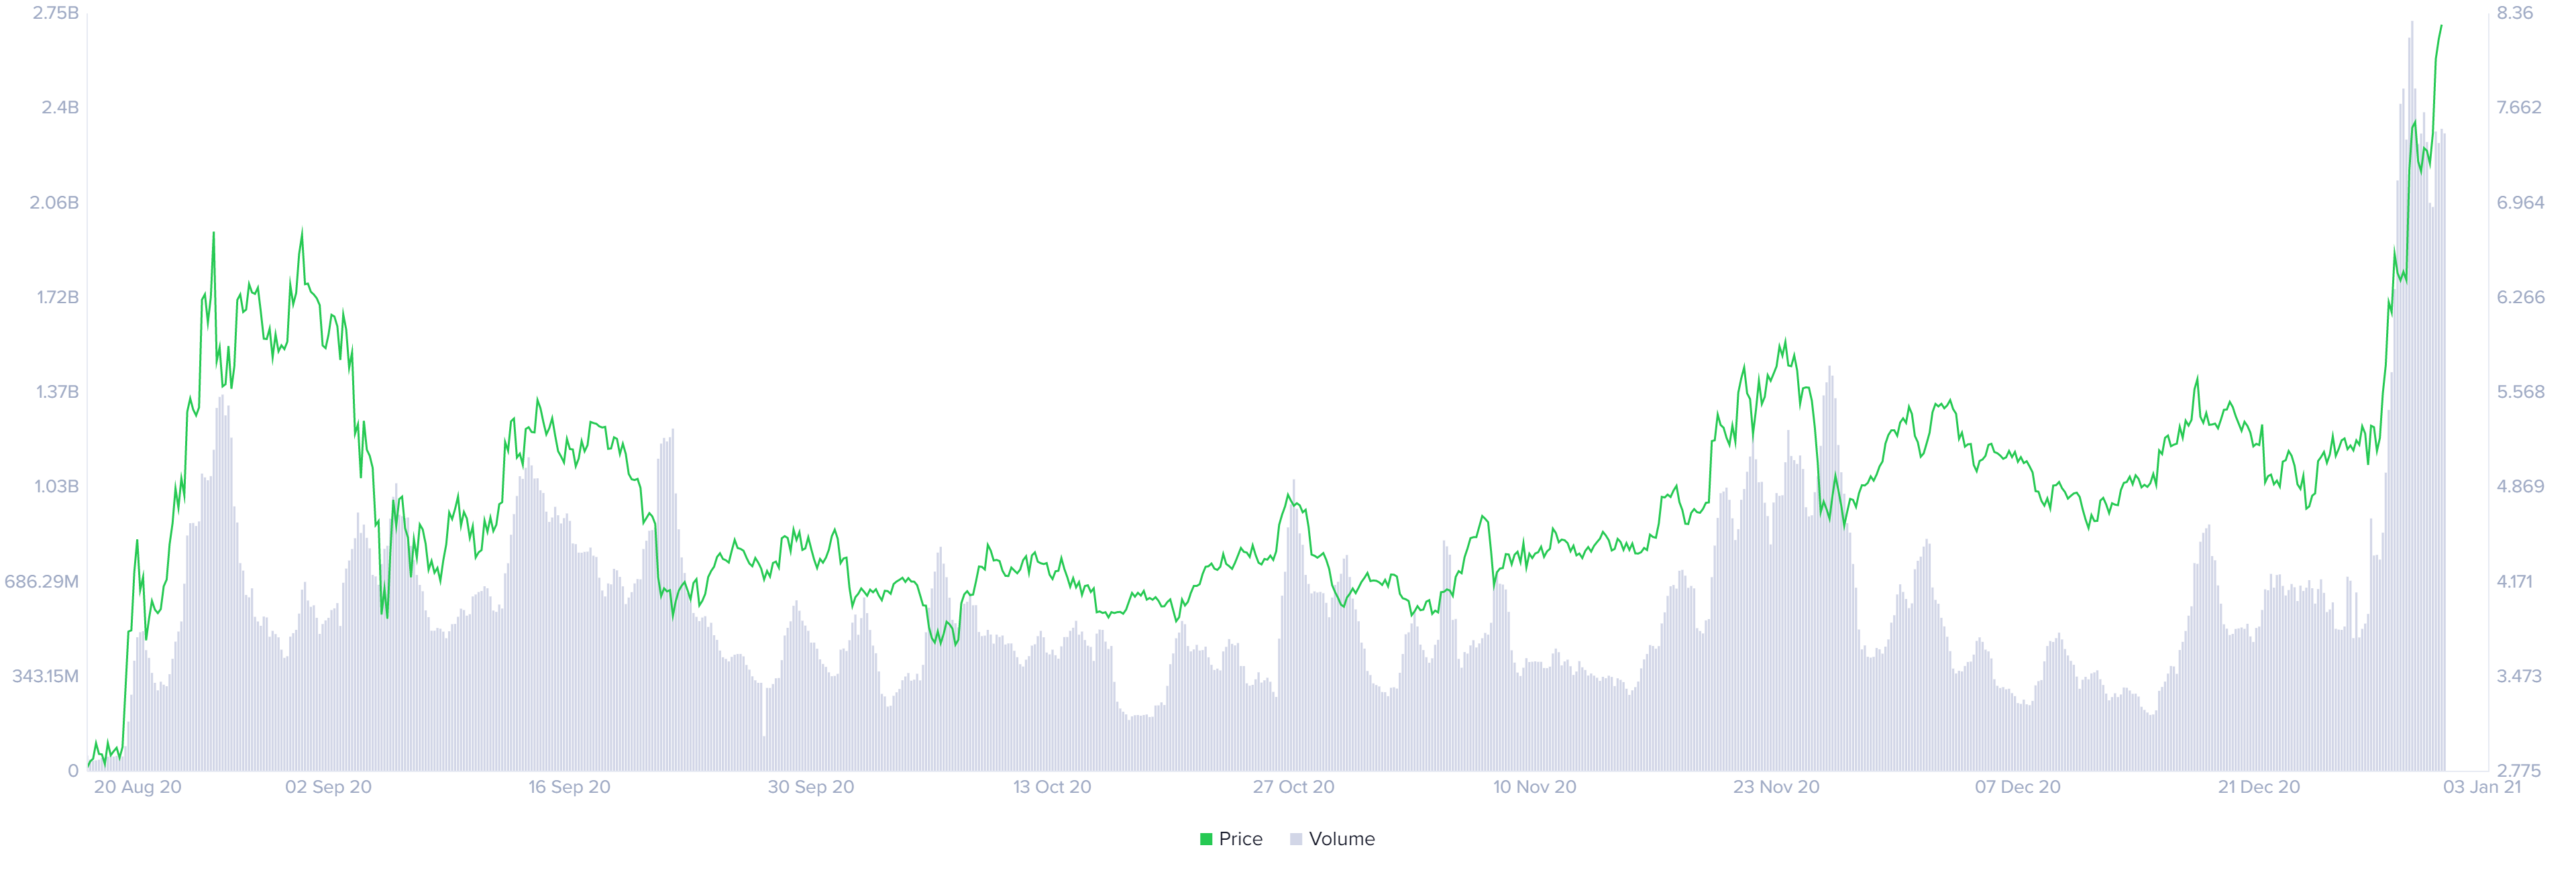
Polkadot has experienced a significant increase in trading volume and a major spike in social volume which could indicate the top is near and a correction is underway.
DOT price could be facing a significant pullback
According to statistics provided by Santiment, Polkadot is seeing a major spike in its social volume which measures the amount of mentions of DOT on social media channels. The last time Polkadot saw a significant spike was on August 26 when the price peaked at $6.27 before crashing down to $4 shortly after.

Additionally, Polkadot has also seen a massive increase in trading volume hitting a new all-time high. Similarly, past DOT price action shows that when the digital asset experiences huge spikes in trading volume, it also retraces within the next couple of days.

Let’s take a look at the 4-hour chart to determine potential DOT price points for the bears if Polkadot does retrace. The 12-EMA has served as an accurate guide for the bulls on the way up and it’s the first line of defense.
DOT/USD 4-hour chart – TradingView
The 12-EMA is currently located at $7.59 and will serve as a robust support level in case of a pullback. Lower, we can find the 26-EMA which is also a strong point currently established at $6.96.
Using the Fibonacci Retracement tool we can determine other potential DOT price targets on the 12-hour chart in case of a major correction. The 0.236 Fib level coincides more or less with the 12-EMA. The next price target at the 0.382 Fib level also coincides with the 26-EMA, adding more credence to both levels.
DOT/USD 12-hour chart – TradingView
Further down, we can find the 0.618 Fib level which is located at $6 and would be the lowest DOT price that bulls can tolerate. Ideally, investors would like to see DOT price retrace down to the first level at $7.5 before another leg up.
Follow CryptoTicker on Twitter and Telegram for daily crypto news and price analyses!

