
Ethereum Price Holds Above $2,500: One Level Is Still Blocking The Way
Ethereum trades at $2,517 after another rejection at the same ceiling. The jobs report lands in hours and decides which way this range breaks.


Which topics should we dive deeper into?
Select what genuinely interests you. Your picks feed directly into our editorial planning.
Crypto news that's actually worth your time.
Weekly. 60 seconds. Carefully curated by our editors: no hype, no promo flood, no spam.
$Ethereum is holding the $2,500 handle, but it is not moving with anything like the conviction $Bitcoin showed yesterday. ETH trades at $2,517.8, up marginally against a previous close of $2,507.6, after tagging $2,546.2 intraday and immediately giving the move back. The current 3 hour candle is actually down 0.35%.
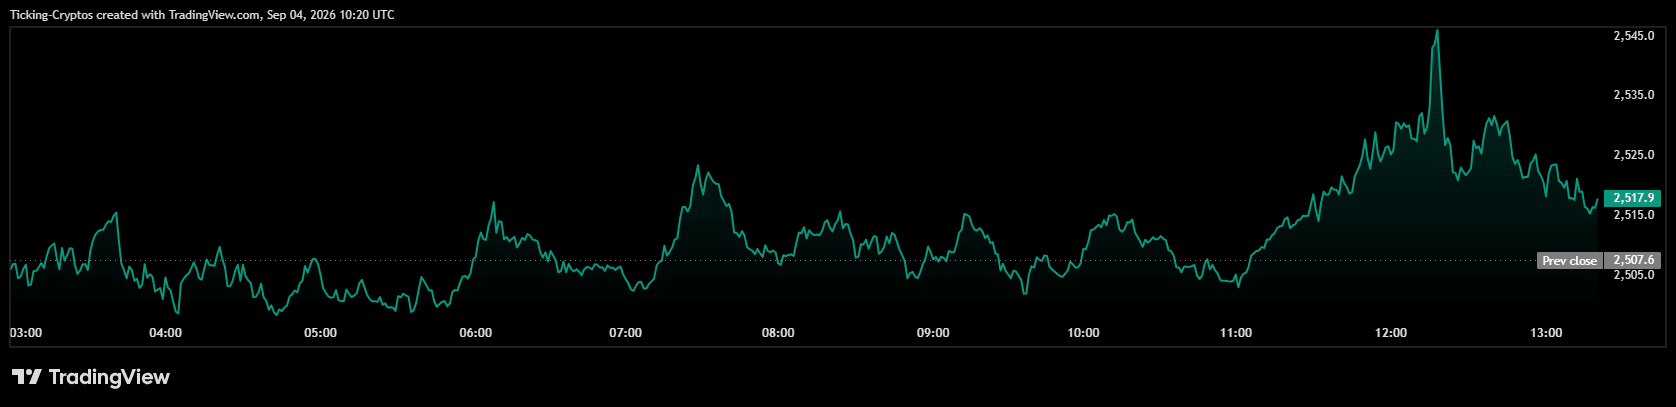
That failed spike is the whole story, and it is the fourth time it has happened in two weeks.
Why Is the Ethereum Price Holding Above $2,500?
Ether is riding the same wave Bitcoin caught on Thursday. Fed Governor Christopher Waller's remarks pushed traders to price in a hold rather than a hike at the September meeting, the dollar sold off, yields eased, and every liquidity sensitive asset caught a bid. ETH went along for the ride from the $2,400 area back over $2,500.
Underneath that, the structural bid is real. Ether gained 32.5% through August while spot ETF inflows crossed $1.852 billion in a single month and exchange reserves declined. Record ETF inflows alongside slightly lower open interest suggest spot buying rather than expanding derivatives exposure is supporting the recovery, which makes the move less fragile than one driven mainly by speculative contracts.
Spot demand with shrinking leverage is a healthier foundation than most crypto rallies get. It also explains why the dips keep getting bought around $2,400 instead of collapsing.
What Does the ETH Chart Say About the $2,550 Ceiling?
Here is where it gets uncomfortable for bulls.
Today's high printed at $2,546.2. That is not a random number. The ceiling sits on the 50 week moving average at $2,542, and analyst Ted Pillows has flagged that Ethereum tried to clear $2,550 and failed again. Sellers have now rejected multiple breakout attempts at that level.
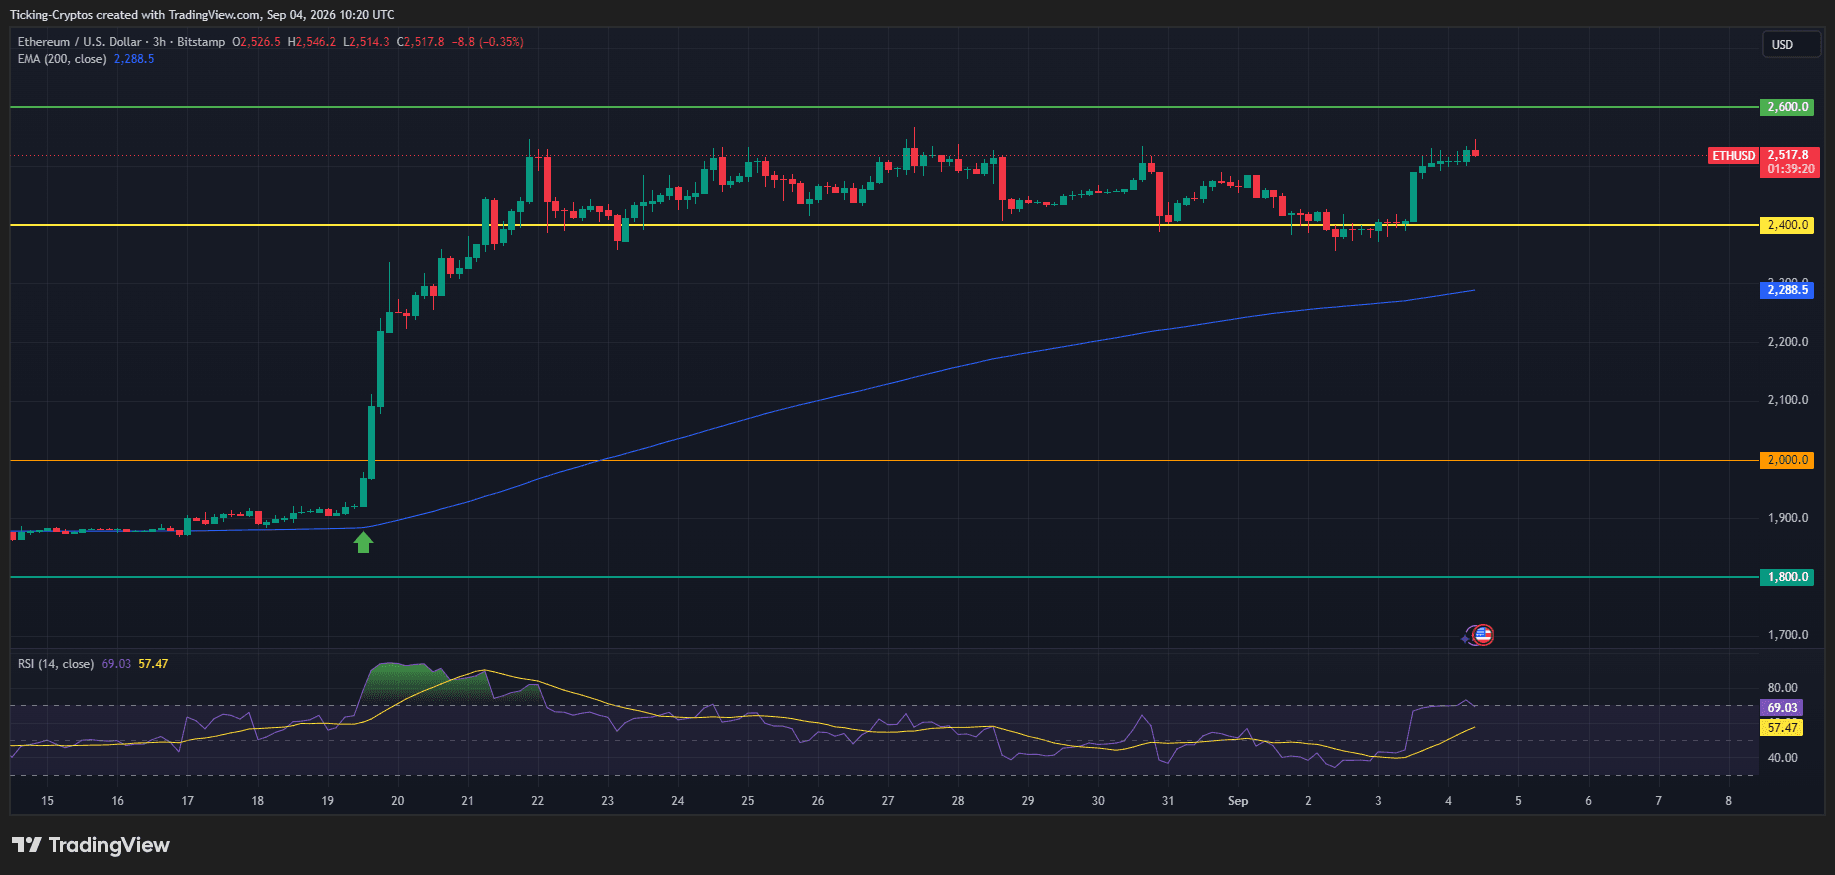
So $ETH did not fail at a psychological round number today. It failed at a weekly moving average that has been capping this market for a year. Look at the 3 hour chart and the shape is unmistakable: since August 21, Ethereum has traded in a box roughly between $2,380 and $2,580, with the upper edge getting tighter each time.
The rest of the structure is genuinely strong:
- The 200 EMA sits at $2,288.5 and is sloping up hard. ETH is trading around 10% above it.
- The $2,400 line has been defended repeatedly, including on Wednesday's flush.
- The mid-August base around $1,880 to $1,900 is a distant memory after the vertical repricing on August 19 and 20.
That August move broke the descending trendline that had capped every rally since the August 2025 peak at $4,958, a line that had held for almost a year, and produced a weekly candle worth more than 31%.
Strong trend, hard ceiling. That is a coiled spring, not a broken chart.
Is the Ethereum RSI Overbought Yet?
Not quite, and that is arguably the most constructive thing on the chart.
The RSI(14) reads 69.03 against its moving average at 57.47. It is pressed right up against the overbought threshold without having crossed it. Compare that to Bitcoin yesterday, which blew through 72 with its signal line still in the mid 40s.
The difference matters. Bitcoin's move was a violent one day repricing that left the indicator stretched and vulnerable. Ethereum has climbed into the same zone gradually over several sessions, with the RSI moving average rising underneath it rather than being left behind. That is what a sustainable grind higher looks like as opposed to a headline spike.
The catch is that an RSI at 69 has very little headroom left before momentum sellers show up, which is exactly what happened at $2,546 this morning.
Why Is Ethereum Outperforming Bitcoin This Cycle?
One detail deserves more attention than it is getting. Ethereum has formed a higher cycle high while Bitcoin has not, which points to stronger relative momentum.
Bitcoin is still trading well below its own cycle peak and spent yesterday reclaiming a level it had already visited in August. Ether, by contrast, has printed structure that Bitcoin has not managed. For a market that spent most of 2026 treating ETH as the weaker asset, that is a meaningful rotation signal.
Whether it holds depends on the next few hours.
 Crypto brokers compared: leverage and derivatives

 Chart analysis tools: the best platforms compared
Which Ethereum Price Levels Matter Next?
Upside:
- $2,546 to $2,550, today's high and the 50 week moving average. Nothing else matters until this goes.
- $2,600, the next horizontal level on the chart and the top of the recent range.
- Above that, analysts have pointed to $2,800 as the target if the pattern resolves higher.
Downside:
- $2,500, the psychological floor ETH is defending right now.
- $2,438, the level that decides whether the August breakout survives.
- $2,400, the horizontal that has absorbed every dip since late August.
- $2,288.5, the 200 EMA and the point where the recovery structure genuinely fails.
What Could Break the Deadlock Today?
The August jobs report, released at 12:30 GMT. Payrolls are expected to rise by 58,000 after July's unexpected drop of 23,000, with the unemployment rate seen holding at 4.1%.
Read this one carefully, because the usual logic is inverted right now. Through 2024 and 2025, weak payrolls meant rate cuts and a relief rally. In September 2026, a strong August print is the hawkish outcome and a soft one is what takes hike risk off the table.
In other words, bad news for the labour market is currently good news for Ethereum. A soft print reinforces Waller's argument for holding rates, keeps the dollar under pressure and gives ETH the liquidity backdrop it needs to finally push through $2,550. A hot print puts the September hike back in play and this range breaks the other way.
The ADP report earlier this week already showed private payrolls rising by just 38,000 in August, below the 47,000 economists expected and the smallest gain in seven months. That leans soft, though ADP is a famously unreliable guide to the official number.
Further out, the Glamsterdam upgrade has slipped to Q4 2026, with the Sepolia testnet fork proposed for late September. That is a catalyst for later this month, not today.
Partner links: some links on this page are partner links. If you become a customer through one of them, we may earn a commission at no extra cost to you. Selection, ratings and ranking are decided independently by our editorial team. Ethics and Independence · Ownership and Funding
For later? Save this article and find it again in your profile.
More on Ethereum: All Ethereum news at a glance
Related articles
- Ethereum Price Crashes Below $2,000: How Low Can ETH Go?
- Why Is Crypto Crashing? The 3 Reasons Behind This Brutal Sell-Off
- Crypto Crash: Why Bitcoin, Ethereum, XRP and Solana Fell This Week and What Comes Next
- Ethereum Price After the Jobs Report: 165,000 New US Jobs Sharpen Fears of a Fed Hike
- Crypto Crash Today: Why Is Bitcoin Stuck Below $82,000?
Which topics should we dive deeper into?
Select what genuinely interests you. Your picks feed directly into our editorial planning.
Crypto news that's actually worth your time.
Weekly. 60 seconds. Carefully curated by our editors: no hype, no promo flood, no spam.

October 8, 2026 5:06 PM

Crypto Crash Reason: Why Bitcoin Fell Below $81,000 and Altcoins Bled Even Harder
Bitcoin slid under $81,000 and Ethereum lost 9% in a week. Here is every crypto crash reason behind the October 2026 selloff explained.
October 8, 2026 4:38 AM

Crypto Market Slides: Bitcoin Loses 4.2 Percent and $651 Million of Long Bets Are Liquidated
Bitcoin has lost 4.2 percent since Tuesday afternoon, and ether and XRP more still. Three reasons can be documented: outflows from the US ETFs, $651 million of forcibly closed long bets and Fed minutes holding out the prospect of another rate rise. A crash it is not, and what to check before buying more is set out here.

October 7, 2026 1:18 PM

2,598 dollars and a sixth day of ETF outflows: will Ethereum hold the 2,500 line?
The Ethereum price stands at $2,598 on Wednesday morning, 3.9 percent below the previous day, while the US spot ETFs report a sixth consecutive trading day of net outflows. This article shows which levels below still hold, how far your leverage sits from the liquidation price, and what the German one-year rule under section 23 of the Income Tax Act means for a sale at a loss.
September 24, 2026 10:36 PM

Ethereum Price Prediction: What to Check on Staking, Leverage and Where You Buy After Three Attempts at $2,800
Ether stands at $2,700 and has bounced off the zone around $2,800 three times in thirty days, without a single daily close above it. What our own count shows, and the three things to settle before the next attempt.
September 22, 2026 7:20 PM

ETH Price Prediction: What to Check at the $2,800 Mark Now
Ether stands at $2,735.96 on September 22, 2026, right below the zone at which it has failed repeatedly. Instead of a target number, you get four checks that count before your next order: holding period, buying route, the staking line and the distance to liquidation.
September 21, 2026 1:13 PM

Ethereum Rises While ETF Money Leaves: What ETH Holders Should Check Now
US ether funds lost $140 million in the week to September 18, ending four weeks of inflows. The ETH price still gained a good 5 percent.
September 21, 2026 11:44 AM
XRP Price Breaks Its Downtrend: Is $2 Finally In Sight?
XRP just snapped the trendline that capped it all September. Here is what the chart says about $1.50, $1.80 and the road to $2.
September 18, 2026 4:41 PM

Solana Price Prediction: Why SOL Is Setting Up for $120
Solana just tagged $110 and the 200 EMA is rising. Here is what the SOL chart says about $120 and what has to hold first.
September 18, 2026 11:39 AM

Ethereum Price Prediction: Why ETH Is Closing In on $3,000
Ethereum is coiling between $2,400 and $2,600 with a rising 200 EMA underneath. Here is what the ETH chart says about $3,000.
September 14, 2026 4:55 PM

Ethereum Price Hit $2,600 Then Stalled: Here Is What Decides the Next Move
Ethereum price tapped $2,600 for the first time since January, then faded. The Fed, the 200 EMA and a wall of ETH supply now decide the next leg.
September 3, 2026 4:04 PM

Bitcoin Price Smashes Back Through $80,000: Here Is What Just Set It Off
Bitcoin price surged to $80,477 in a matter of hours after a dovish Fed signal crushed rate hike bets. Here is the chart and the real driver.
September 1, 2026 11:14 AM

XRP Price Falls 8% in a Week: Is This Dip Actually Worth Buying?
XRP gave back 8% this week after a violent August melt-up. Here is what really drove that rally, what the chart says now, and what buying here depends on.
August 30, 2026 10:56 AM

Ethereum Price Prediction: Can ETH Blast Toward $2,750 Next?
Ethereum price prediction after a 30% August rally: ETH sits at $2,453 with RSI cooling. Here are the bullish and bearish ETH price targets.
August 29, 2026 10:30 AM
XRP Price Prediction: XRP Ripped From $1 To $1.66 In Three Days, Here Is Where It Goes Next
XRP exploded 66% off the $1 floor, then gave back a third of it. Here is the full chart breakdown and the XRP price targets that matter now.
August 25, 2026 3:56 PM

Bitcoin Price Cracks $80,000 Then Cools While Altcoins Push Higher
Bitcoin cleared 80,000 dollars for the first time since May, then slipped to 79,100. Chart analysis, upside targets and key support levels.
August 21, 2026 5:08 PM

Ethereum Price Above $2,300: 3 Reasons Why ETH Is Leading This Rally
Ethereum jumped past $2,300 and is now testing $2,400. ETH is outpacing Bitcoin, and the reasons are specific to Ethereum.
August 19, 2026 6:13 PM

Ethereum Price Explodes 9.5% and Stops 1% Short of THE Level
ETH just outran Bitcoin, reclaimed $2,000 and closed 23 dollars below the line it has not touched all year.
August 18, 2026 9:31 AM

Crypto News Today: The CLARITY Act Vote Nears and Bitcoin Holds Its Range
Bitcoin trades near $78,600 with the market cap back above $2.68 trillion. ETF flows turned positive in August, and the CLARITY Act cloture vote lands on 15 September.
August 9, 2026 11:08 AM

Bitcoin and Ethereum ETFs Attract $1.1B — Why Are Crypto Prices Still Flat?
Bitcoin and Ethereum ETFs attracted $1.1 billion in one week, but BTC and ETH barely moved. Here is why the market reaction remains muted.
July 25, 2026 11:27 AM

Crypto Price Today: Market Slides Again as Bitcoin Fails at $67,000
Bitcoin slipped back under $64,000 after tapping $66,990. Oil, ETF outflows and Fed nerves are dragging the whole crypto market lower.
July 23, 2026 11:31 AM
Ethereum Price Nears $2,000: Can ETH Break Resistance? Price Targets & Analysis
Ethereum trades at $1,921 and is testing the key $2,000 level after a strong July recovery. Here are the high and low targets to watch next.
July 21, 2026 10:21 AM

Crypto Market Rebounds: Bitcoin Reclaims $66K and Ethereum Tops $1,900 as Inflation Fears Ease
Bitcoin is back above $66,000 and Ethereum has topped $1,900 as secondary inflation fears fade and ETF inflows return. Here's what's driving today's rally.
June 1, 2026 7:51 AM

Ethereum Price Breaks $2,000 Support While Bearish Sentiment Drives ETH to Lower Targets
Ethereum has dropped below the crucial $2,000 psychological level. Technical indicators hint at further losses toward a stronger support area.
May 16, 2026 2:22 PM

Ethereum Price Analysis as ETH risks Crashing below the $2,000 Support
Ethereum struggles to stay above key support levels. Technical charts and rising exchange inflows indicate that ETH could drop below $2,000 soon.
May 12, 2026 3:51 PM

Bitcoin Holds $80,000 as XRP Outpaces Market Amid ETF Surge
Bitcoin maintains its $80,000 support while XRP breaks key resistance. Discover how institutional ETF inflows and market shifts are driving crypto prices today.


More from CryptoTicker