Dash Price Analysis – Can DASH Still Reach The 150$ Mark?
The Dash Price was able to rise significantly, but is still modest when compared to other cryptocurrencies! Dash Price Forecast – 50-Weekly-EMA support and golden ratio resistance! the DASH price was able to reach the golden ratio at the $100 […]


The Dash Price was able to rise significantly, but is still modest when compared to other cryptocurrencies!
Dash Price Forecast – 50-Weekly-EMA support and golden ratio resistance!
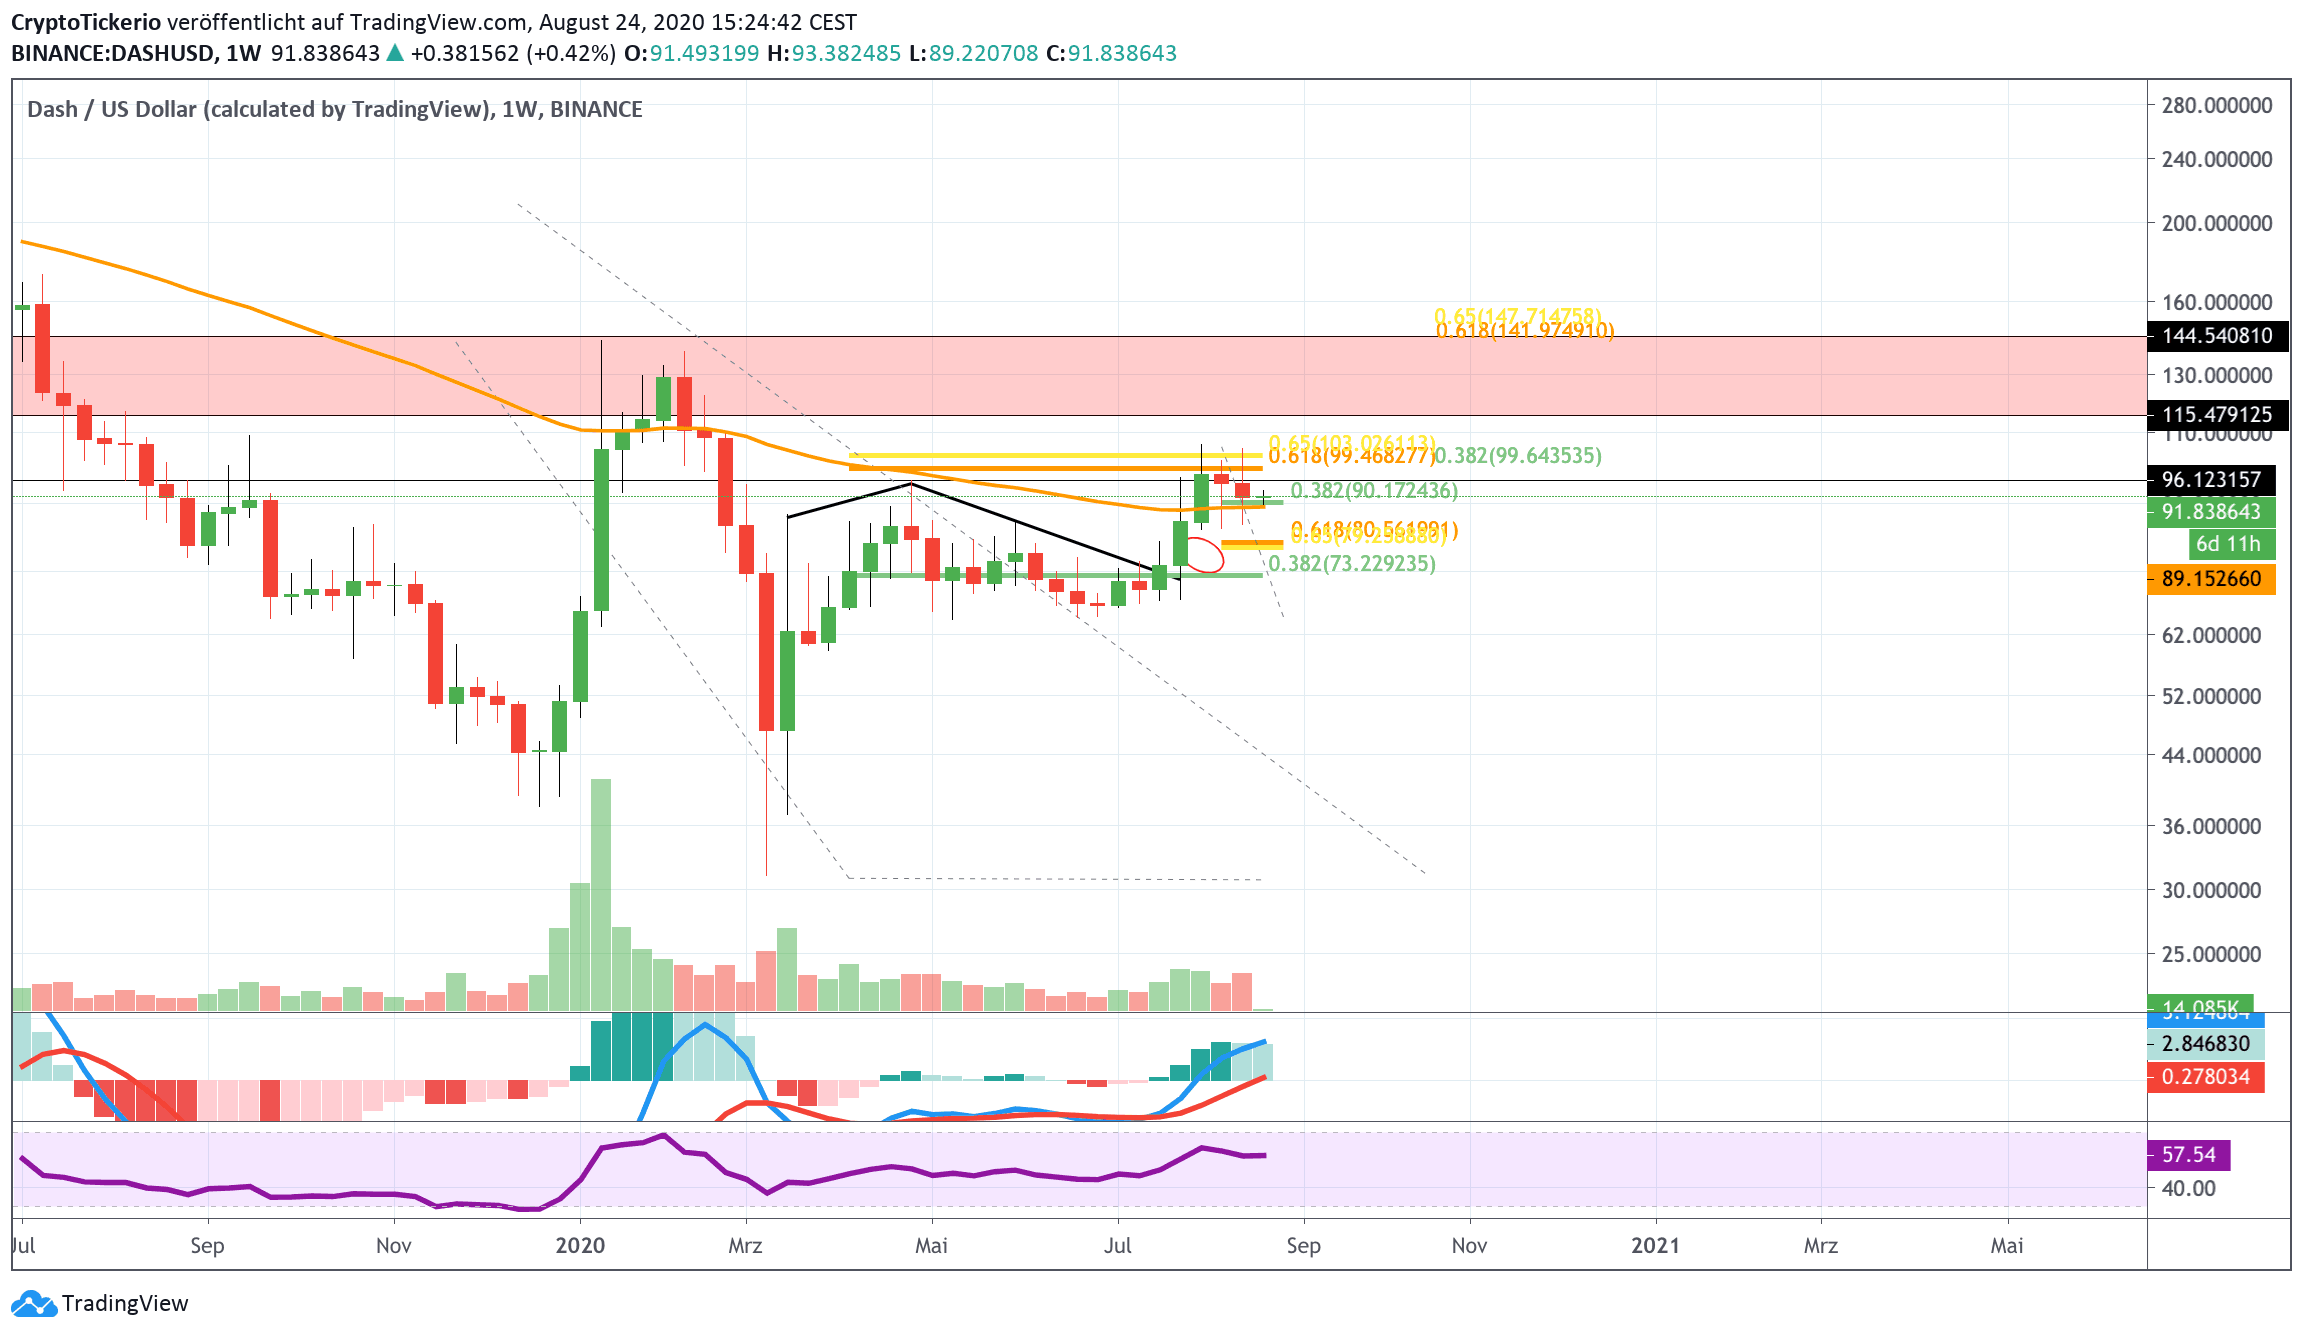
the DASH price was able to reach the golden ratio at the $100 mark, but was bearishly rejected there so far. The MACD histogram has also started to tick lower bearishly. Currently, the DASH price finds support at the 50-Weekly-EMA at the 0.382 Fib level at the $90 mark. Should this support level not hold, DASH could drop down to the golden ratio at the $80 mark.
Dash Price Forecast – 200-Daily-EMA serves as resistance!
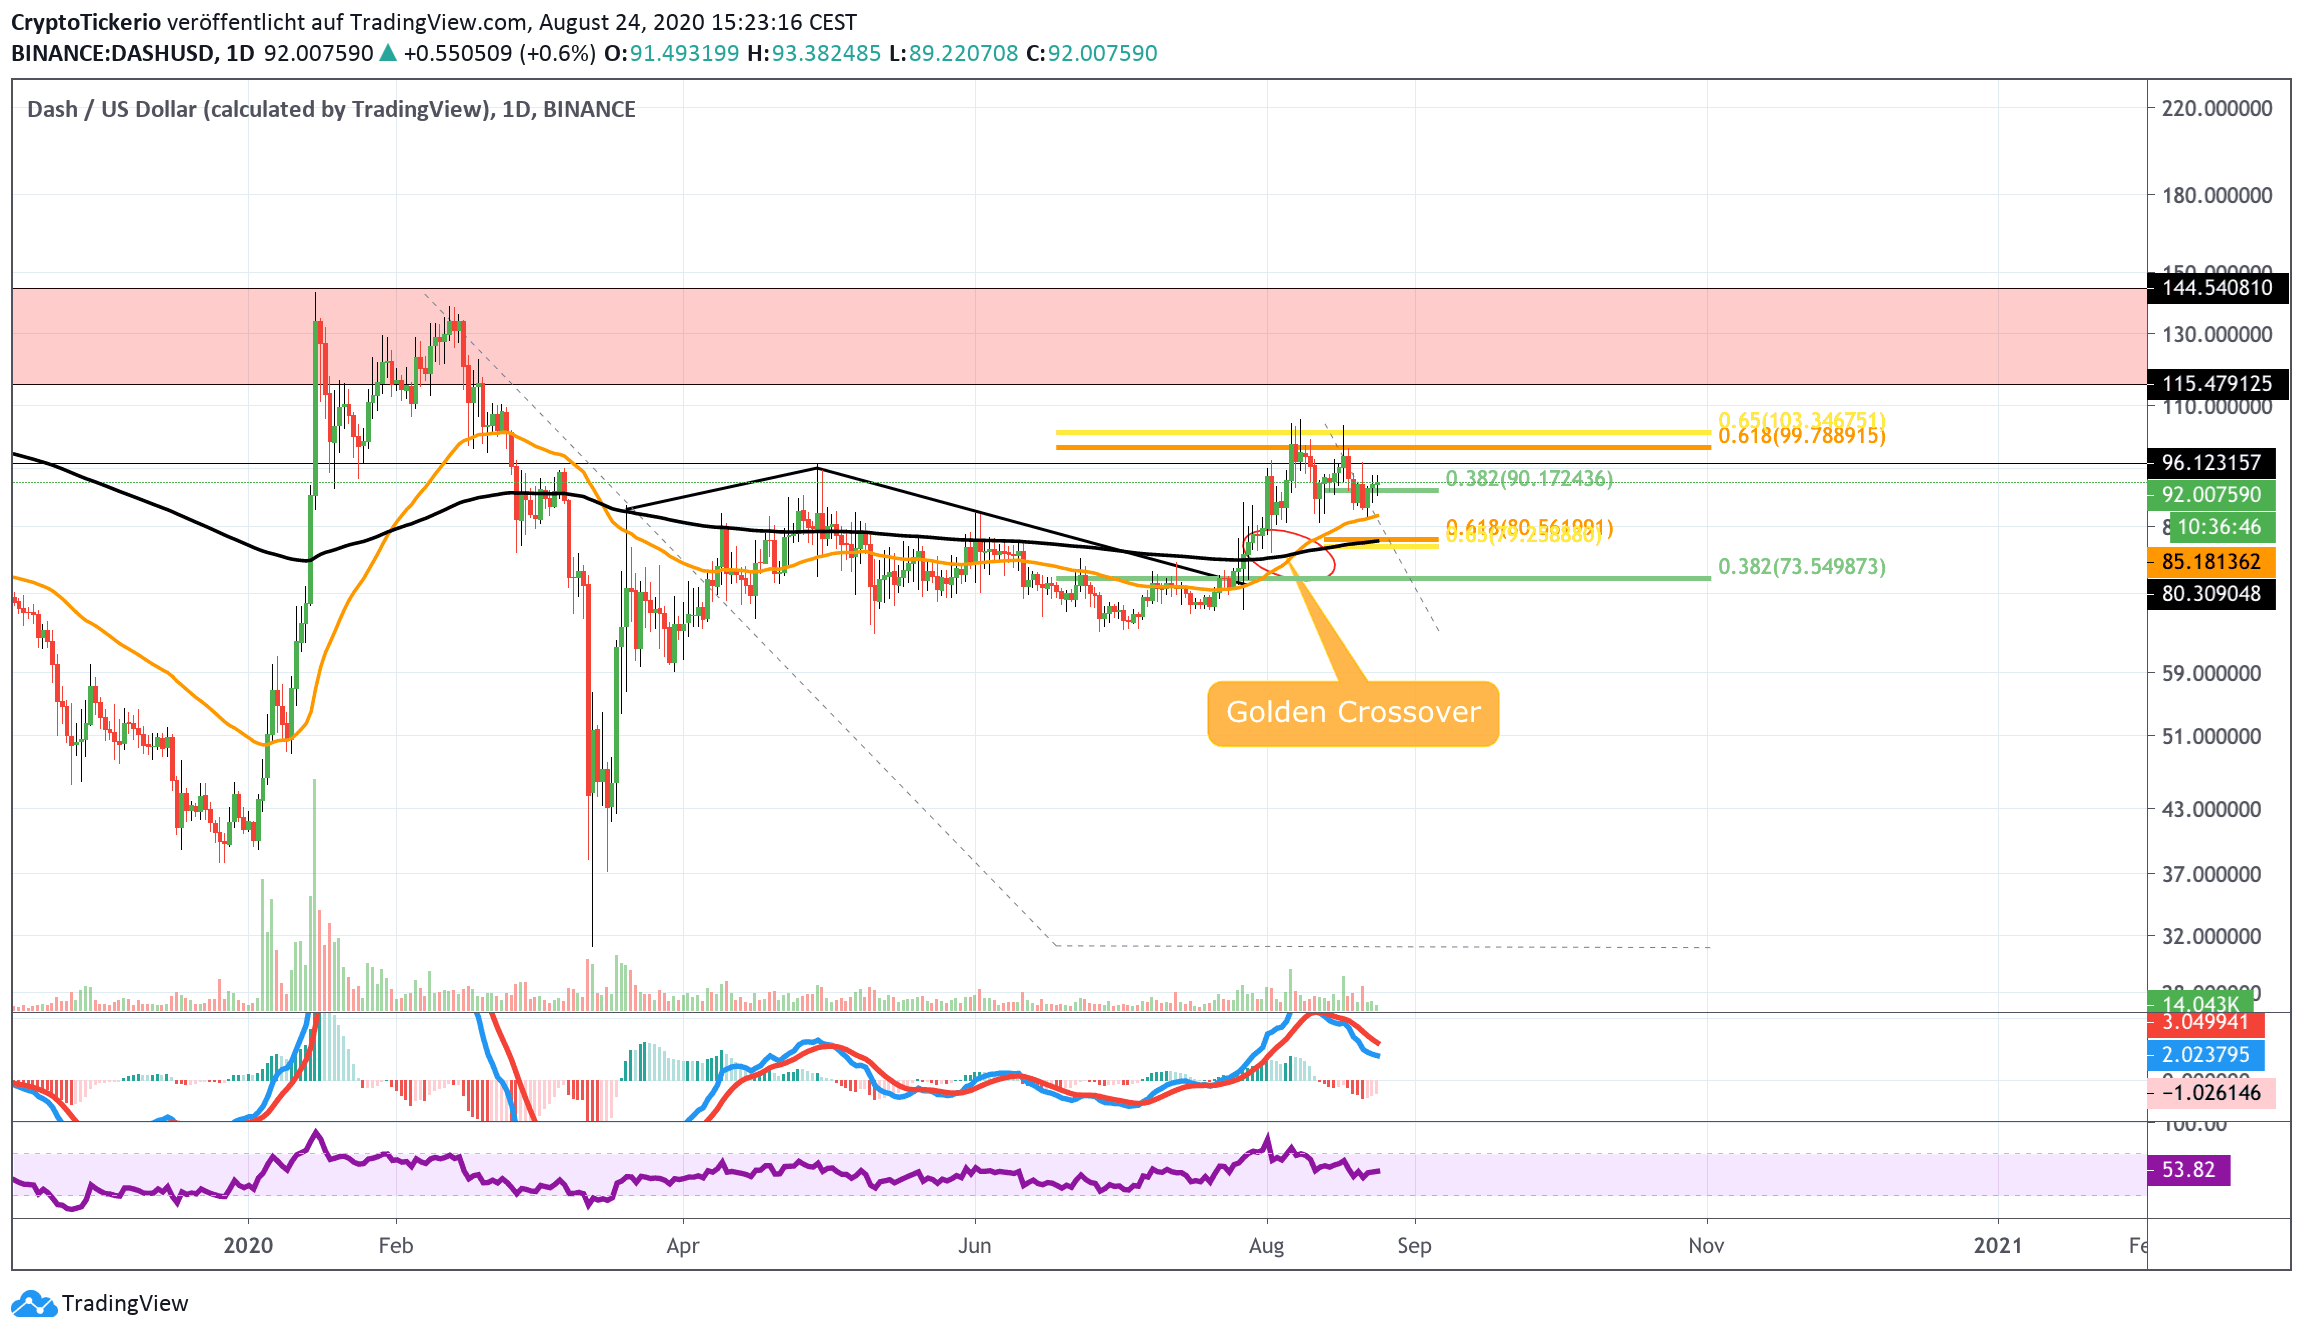
In the daily chart a golden crossover occurred, confirming the bullish trend for the midterm. The bearish rejection at the golden ratio however, counts as a confirmation of the bearish trend for the time being. Now, it mostly depends on whether or not DASH can bounce at the golden ratio at $80, in order to decide whether the DASH price begins a bullish trend, or whether it will remain in its current bearish state.
After all the DASH price will definitely have to break the golden ratio at the $100 mark to be bullish.
At least the RSI isn’t showing any selling signals, and the MACD histogram has started to tick bullishly higher. Only the MACD lines are still bearishly crossed.
Dash Price Forecast – DASH in a bear trend?
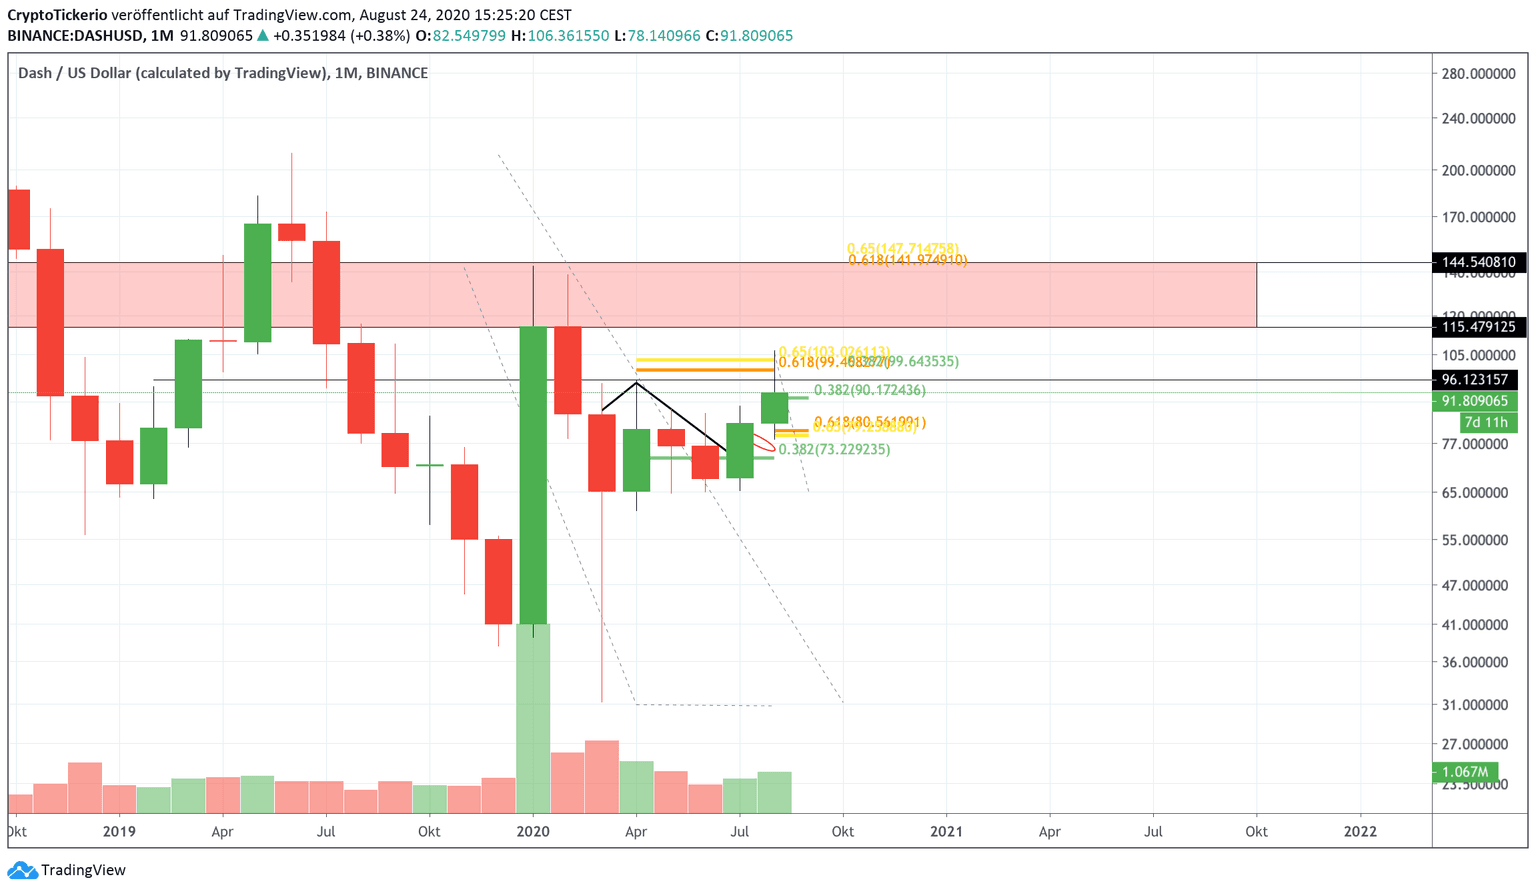
Should the Dash price break the golden ratio at $100, the next golden ratio would be waiting for Dash at $145, which functions as a significant resistance. Between those levels lays a horizontal resistance between $115 and $144.
Currently the Dash price finds itself between two golden ratios. If the trend contines bullish or bearish, depends on which golden ratio will be broken first. If Dash passes $100, things will be looking good. If it falls under $80, things would look rather bleak!
Dash Price Forecast – Descending channel and upwards potential!
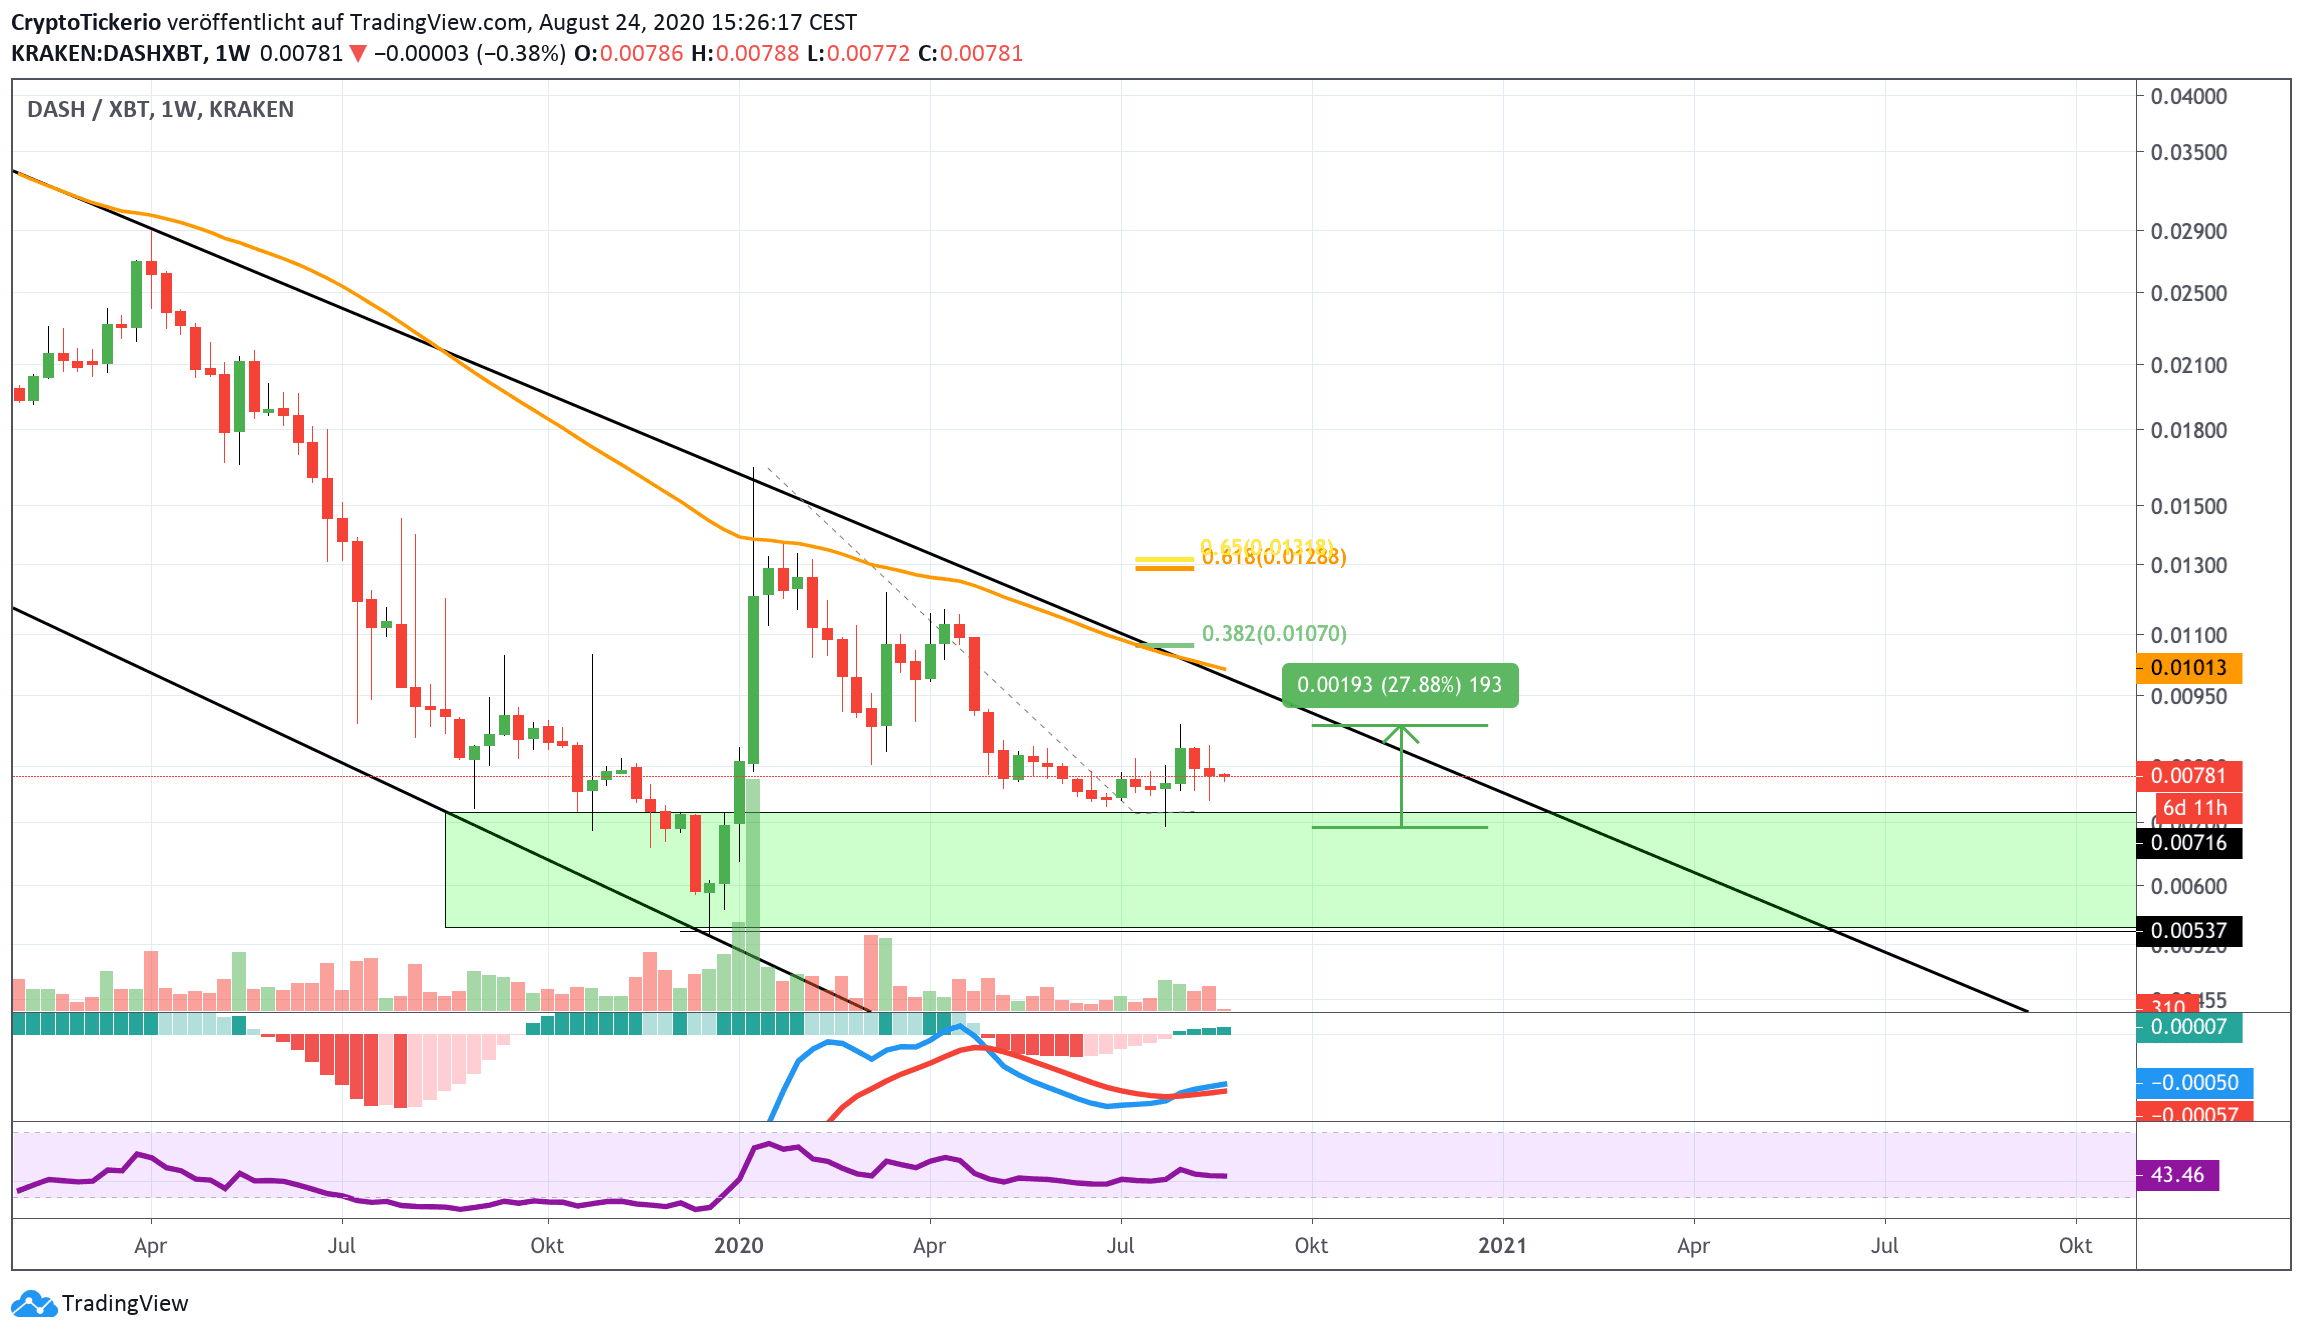
Dash finds itself in a parallel descending channel against Bitcoin, which is setting the tone here. As such, the macro trend of Dash is still a bearish one. However, Dash was able to strongly bounce up at the horizontal support between 0.00537 – 0.00716 BTC, causing a 28% increase in the Dash price. As far as this support holds, Dash could go up to the 0.382 Fib level at 0.0107 BTC. The MACD is bullish against Bitcoin in the weekly chart. The RSI also still has a lot of room up.
Best Regards and successful trading
Konstantin
Want more news and price analyses? Join CryptoTicker on Telegram and Twitter