Bitcoin Price Crashes, Key Tips To Buy The Dip
The last crash wiped around $90 billion of the total market capitalization of crypto. Massive pullbacks are not uncommon in the crypto industry and for Bitcoin. During the past bull rally throughout 2016 and 2017, Bitcoin suffered around 9 significant […]


The last crash wiped around $90 billion of the total market capitalization of crypto. Massive pullbacks are not uncommon in the crypto industry and for Bitcoin. During the past bull rally throughout 2016 and 2017, Bitcoin suffered around 9 significant retracements averaging 30-35% each.
This recent pullback is only 17% which could indicate that a bigger one is still coming. However, it’s important to realize that the current market condition is different as more institutional investors are participating.
Bitcoin price hit $19,484 on November 25 and dropped to a low of $16,188 around 48 hours later. This last drop doesn’t actually change much when it comes to the daily uptrend which is still in place. Bears would need to establish a lower high first and then a clear lower low to confirm a downtrend.
The digital asset has lost the 12-EMA for the first time in months but managed to stay above the 26-EMA at $16,637.
When to buy the dip if Bitcoin price crashes?
Cryptocurrency enthusiasts are always talking about ‘buying dips’ but this idea might be harder than you think. Of course, if you are planning to hold for a long time, and we are talking about years, buying any dip would probably be a decent strategy.
However, if your plan for the future is shorter, you need a better strategy. Looking back at the crash after the all-time high in early 2018, buying the dip was clearly not a good idea.
The main problem is to determine whether this dip is just a small correction in the way of a new all-time high or just the beginning of a reversal. So far, Bitcoin was able to jump 7% towards the current price of $17,320 but this could very easily be what’s known as a bull trap.
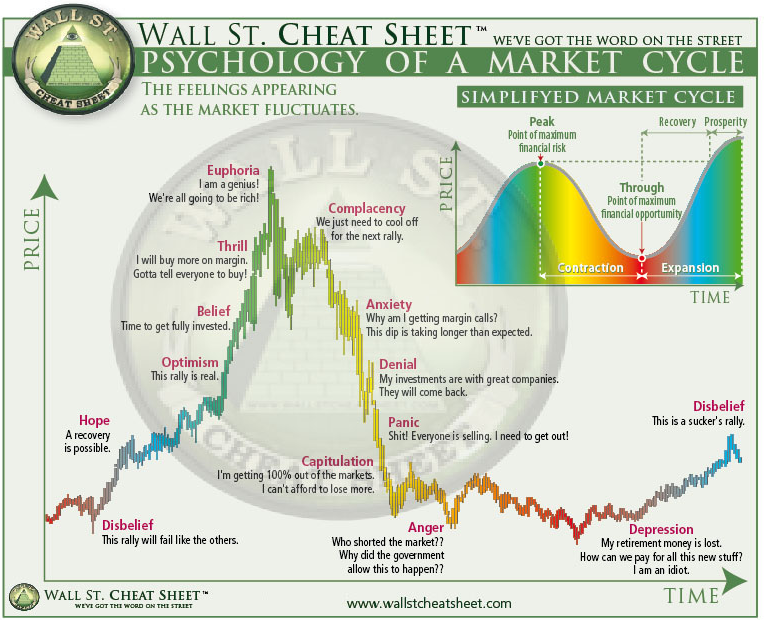
This classic psychology chart of market cycles can be a useful tool for traders. Are we close to the ‘Complacency’ cycle where the asset has a notable bounce only to fall harder? Or is this the ‘Disbelief’ part meaning that it’s only the beginning?
BTC/USD daily chart – TradingView
The difference between the two is critical, but how to find out? It’s not entirely possible to know for sure. However, we can establish some potential price targets to find out in the future. During the major bull rally to $20,000, Bitcoin lost the 12-EMA after a 16% drop, followed by another 35% drop, losing close to 50% of its value in less than a week.
Then it had its first bounce towards $16,500, which could be considered the first bull trap. Surprisingly, it had another two weeks later that managed to push it higher at $17,176. Bitcoin has dropped below the 12-EMA but managed to defend the 26-EMA. This seems to be a potential price target to start scaling in.
BTC/USD daily chart – TradingView
Failure to hold the 26-EMA at $16,646 would be a major sign of a reversal. If Bitcoin price can bounce above the 12-EMA, the bearish outlook would be invalidated. On the other hand, if we drop below the 26-EMA and then rebound, we would need to pay attention to a potential bull trap like the one in 2017.
Make sure to join our Trading Group on Telegram for more awesome tips!